Immigrants from Norway vs Thai Male Disability
COMPARE
Immigrants from Norway
Thai
Male Disability
Male Disability Comparison
Immigrants from Norway
Thais
11.3%
MALE DISABILITY
44.2/ 100
METRIC RATING
177th/ 347
METRIC RANK
9.2%
MALE DISABILITY
100.0/ 100
METRIC RATING
4th/ 347
METRIC RANK
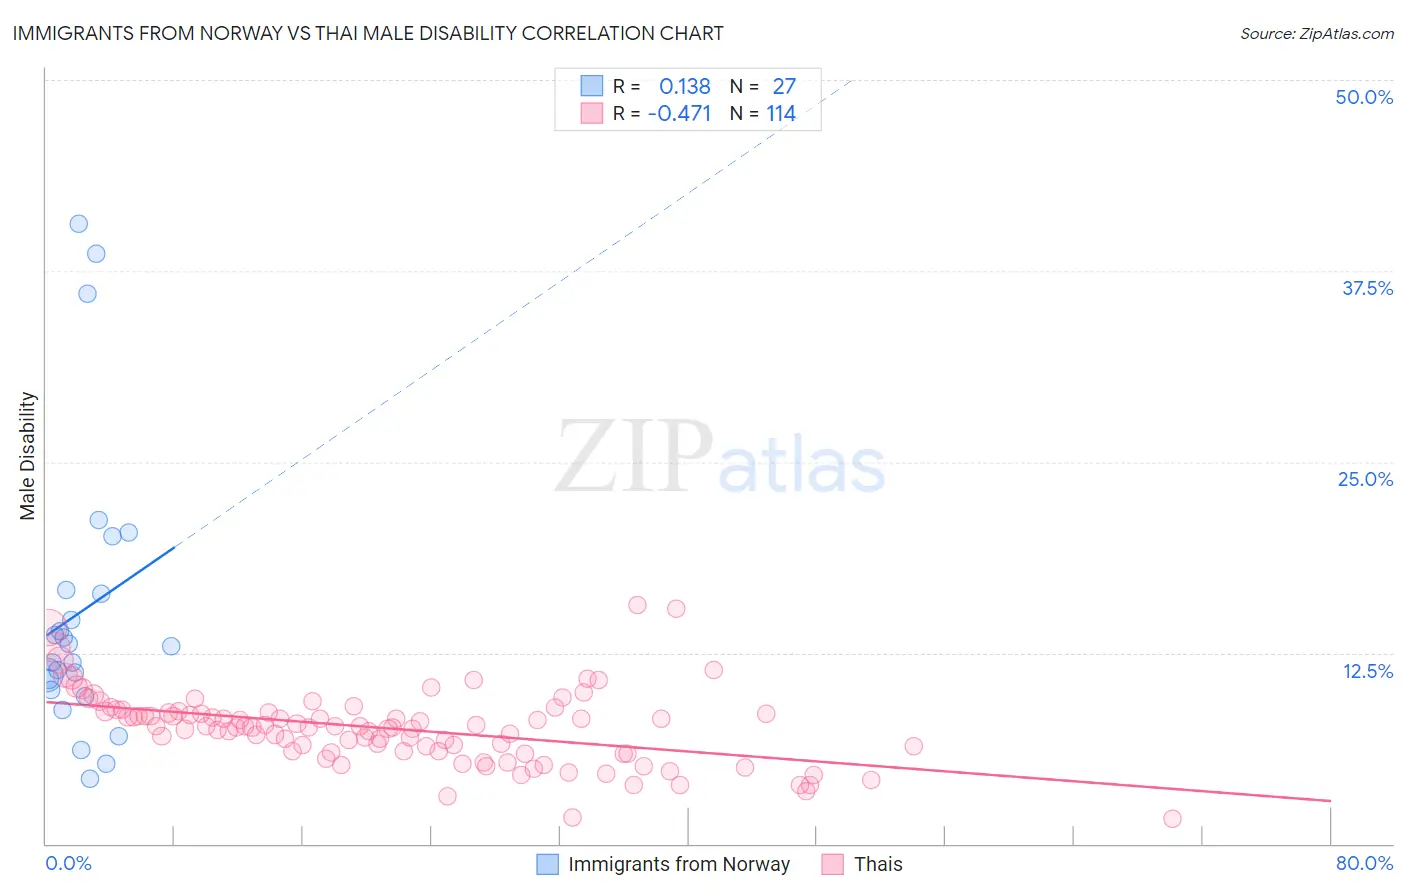
Immigrants from Norway vs Thai Male Disability Correlation Chart
The statistical analysis conducted on geographies consisting of 116,706,385 people shows a poor positive correlation between the proportion of Immigrants from Norway and percentage of males with a disability in the United States with a correlation coefficient (R) of 0.138 and weighted average of 11.3%. Similarly, the statistical analysis conducted on geographies consisting of 475,773,320 people shows a moderate negative correlation between the proportion of Thais and percentage of males with a disability in the United States with a correlation coefficient (R) of -0.471 and weighted average of 9.2%, a difference of 21.9%.
Male Disability Correlation Summary
| Measurement | Immigrants from Norway | Thai |
| Minimum | 4.3% | 1.6% |
| Maximum | 40.6% | 15.6% |
| Range | 36.4% | 14.0% |
| Mean | 15.2% | 7.5% |
| Median | 12.9% | 7.6% |
| Interquartile 25% (IQ1) | 10.1% | 6.0% |
| Interquartile 75% (IQ3) | 16.6% | 8.6% |
| Interquartile Range (IQR) | 6.6% | 2.5% |
| Standard Deviation (Sample) | 9.4% | 2.4% |
| Standard Deviation (Population) | 9.2% | 2.4% |
Similar Demographics by Male Disability
Demographics Similar to Immigrants from Norway by Male Disability
In terms of male disability, the demographic groups most similar to Immigrants from Norway are Australian (11.3%, a difference of 0.11%), Syrian (11.2%, a difference of 0.13%), Immigrants from Caribbean (11.3%, a difference of 0.15%), Honduran (11.3%, a difference of 0.17%), and Immigrants from Honduras (11.2%, a difference of 0.25%).
| Demographics | Rating | Rank | Male Disability |
| New Zealanders | 52.9 /100 | #170 | Average 11.2% |
| Haitians | 52.5 /100 | #171 | Average 11.2% |
| Romanians | 50.7 /100 | #172 | Average 11.2% |
| Immigrants | Burma/Myanmar | 50.4 /100 | #173 | Average 11.2% |
| Maltese | 50.0 /100 | #174 | Average 11.2% |
| Immigrants | Honduras | 48.7 /100 | #175 | Average 11.2% |
| Syrians | 46.6 /100 | #176 | Average 11.2% |
| Immigrants | Norway | 44.2 /100 | #177 | Average 11.3% |
| Australians | 42.2 /100 | #178 | Average 11.3% |
| Immigrants | Caribbean | 41.4 /100 | #179 | Average 11.3% |
| Hondurans | 41.1 /100 | #180 | Average 11.3% |
| Immigrants | Senegal | 34.4 /100 | #181 | Fair 11.3% |
| Immigrants | Belize | 33.7 /100 | #182 | Fair 11.3% |
| Immigrants | Central America | 32.9 /100 | #183 | Fair 11.3% |
| Iraqis | 30.5 /100 | #184 | Fair 11.3% |
Demographics Similar to Thais by Male Disability
In terms of male disability, the demographic groups most similar to Thais are Filipino (9.1%, a difference of 1.3%), Immigrants from Taiwan (9.1%, a difference of 1.3%), Immigrants from Hong Kong (9.4%, a difference of 2.1%), Immigrants from South Central Asia (9.4%, a difference of 2.2%), and Immigrants from India (9.0%, a difference of 2.2%).
| Demographics | Rating | Rank | Male Disability |
| Immigrants | India | 100.0 /100 | #1 | Exceptional 9.0% |
| Immigrants | Taiwan | 100.0 /100 | #2 | Exceptional 9.1% |
| Filipinos | 100.0 /100 | #3 | Exceptional 9.1% |
| Thais | 100.0 /100 | #4 | Exceptional 9.2% |
| Immigrants | Hong Kong | 100.0 /100 | #5 | Exceptional 9.4% |
| Immigrants | South Central Asia | 100.0 /100 | #6 | Exceptional 9.4% |
| Immigrants | Bolivia | 100.0 /100 | #7 | Exceptional 9.5% |
| Immigrants | China | 100.0 /100 | #8 | Exceptional 9.5% |
| Immigrants | Singapore | 100.0 /100 | #9 | Exceptional 9.5% |
| Immigrants | Israel | 100.0 /100 | #10 | Exceptional 9.6% |
| Immigrants | Eastern Asia | 100.0 /100 | #11 | Exceptional 9.6% |
| Bolivians | 100.0 /100 | #12 | Exceptional 9.6% |
| Iranians | 100.0 /100 | #13 | Exceptional 9.7% |
| Immigrants | Iran | 100.0 /100 | #14 | Exceptional 9.7% |
| Indians (Asian) | 100.0 /100 | #15 | Exceptional 9.7% |