Immigrants from Norway vs Subsaharan African Master's Degree
COMPARE
Immigrants from Norway
Subsaharan African
Master's Degree
Master's Degree Comparison
Immigrants from Norway
Sub-Saharan Africans
18.8%
MASTER'S DEGREE
100.0/ 100
METRIC RATING
46th/ 347
METRIC RANK
14.2%
MASTER'S DEGREE
19.4/ 100
METRIC RATING
210th/ 347
METRIC RANK
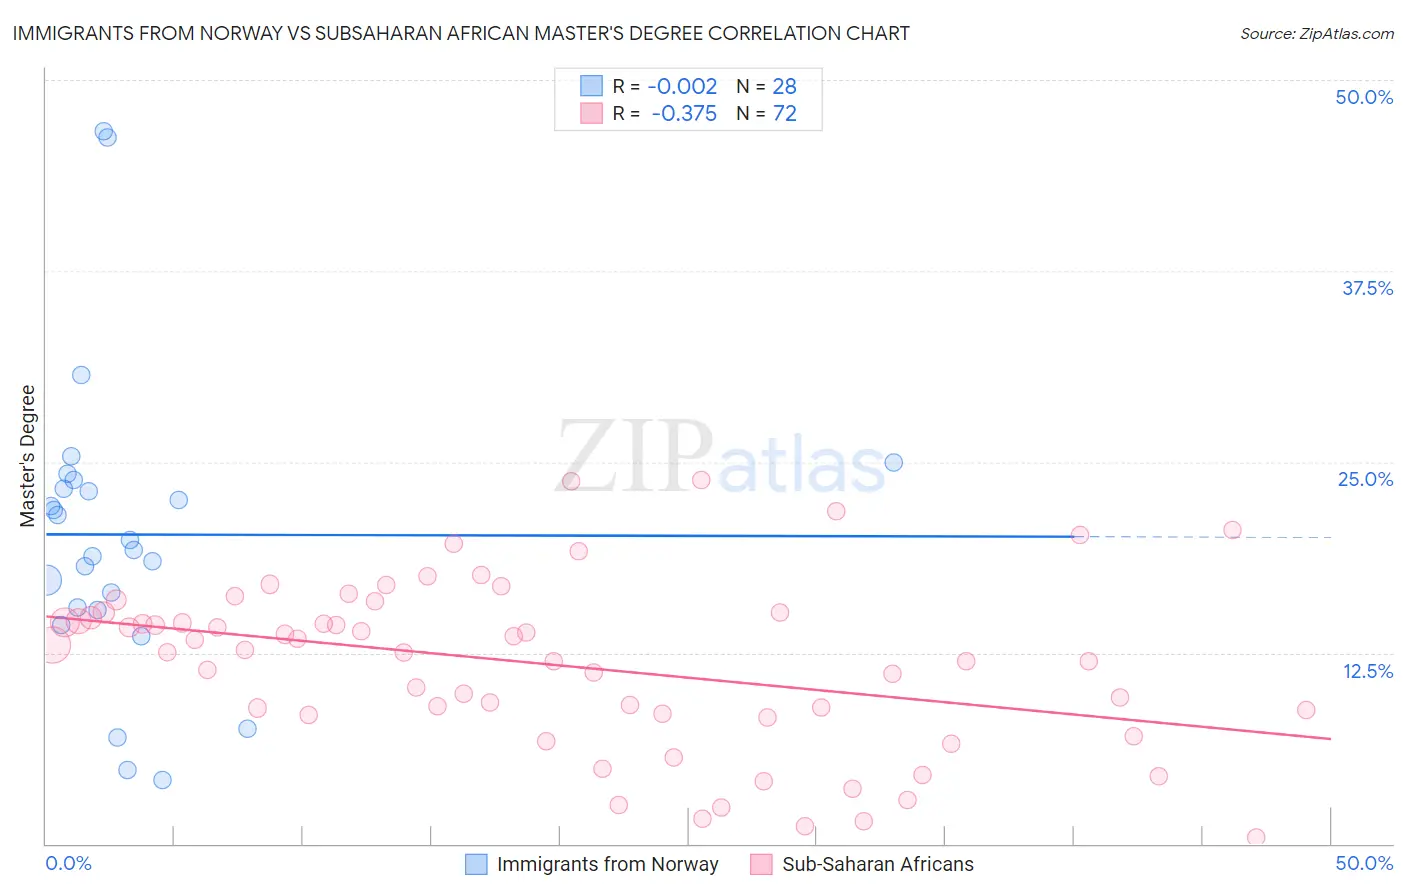
Immigrants from Norway vs Subsaharan African Master's Degree Correlation Chart
The statistical analysis conducted on geographies consisting of 116,700,664 people shows no correlation between the proportion of Immigrants from Norway and percentage of population with at least master's degree education in the United States with a correlation coefficient (R) of -0.002 and weighted average of 18.8%. Similarly, the statistical analysis conducted on geographies consisting of 507,799,388 people shows a mild negative correlation between the proportion of Sub-Saharan Africans and percentage of population with at least master's degree education in the United States with a correlation coefficient (R) of -0.375 and weighted average of 14.2%, a difference of 32.2%.
Master's Degree Correlation Summary
| Measurement | Immigrants from Norway | Subsaharan African |
| Minimum | 4.2% | 0.40% |
| Maximum | 46.7% | 23.9% |
| Range | 42.5% | 23.5% |
| Mean | 20.2% | 11.7% |
| Median | 19.6% | 12.6% |
| Interquartile 25% (IQ1) | 15.4% | 8.5% |
| Interquartile 75% (IQ3) | 23.5% | 15.0% |
| Interquartile Range (IQR) | 8.1% | 6.5% |
| Standard Deviation (Sample) | 9.8% | 5.5% |
| Standard Deviation (Population) | 9.6% | 5.5% |
Similar Demographics by Master's Degree
Demographics Similar to Immigrants from Norway by Master's Degree
In terms of master's degree, the demographic groups most similar to Immigrants from Norway are Immigrants from Austria (18.8%, a difference of 0.010%), Paraguayan (18.8%, a difference of 0.070%), Estonian (18.8%, a difference of 0.17%), Bulgarian (18.8%, a difference of 0.35%), and Immigrants from South Africa (18.8%, a difference of 0.37%).
| Demographics | Rating | Rank | Master's Degree |
| Immigrants | Spain | 100.0 /100 | #39 | Exceptional 19.1% |
| Immigrants | Bolivia | 100.0 /100 | #40 | Exceptional 19.1% |
| Immigrants | Latvia | 100.0 /100 | #41 | Exceptional 19.1% |
| Immigrants | Saudi Arabia | 100.0 /100 | #42 | Exceptional 19.0% |
| Immigrants | Greece | 100.0 /100 | #43 | Exceptional 19.0% |
| Immigrants | Malaysia | 100.0 /100 | #44 | Exceptional 18.9% |
| Immigrants | Belarus | 100.0 /100 | #45 | Exceptional 18.9% |
| Immigrants | Norway | 100.0 /100 | #46 | Exceptional 18.8% |
| Immigrants | Austria | 100.0 /100 | #47 | Exceptional 18.8% |
| Paraguayans | 100.0 /100 | #48 | Exceptional 18.8% |
| Estonians | 100.0 /100 | #49 | Exceptional 18.8% |
| Bulgarians | 100.0 /100 | #50 | Exceptional 18.8% |
| Immigrants | South Africa | 100.0 /100 | #51 | Exceptional 18.8% |
| Immigrants | Kuwait | 100.0 /100 | #52 | Exceptional 18.6% |
| Immigrants | Czechoslovakia | 99.9 /100 | #53 | Exceptional 18.5% |
Demographics Similar to Sub-Saharan Africans by Master's Degree
In terms of master's degree, the demographic groups most similar to Sub-Saharan Africans are Immigrants from Panama (14.3%, a difference of 0.13%), Immigrants from Barbados (14.3%, a difference of 0.22%), Somali (14.2%, a difference of 0.31%), Spanish (14.2%, a difference of 0.36%), and Immigrants from Bosnia and Herzegovina (14.3%, a difference of 0.52%).
| Demographics | Rating | Rank | Master's Degree |
| Yugoslavians | 24.3 /100 | #203 | Fair 14.4% |
| French | 23.7 /100 | #204 | Fair 14.4% |
| Trinidadians and Tobagonians | 23.5 /100 | #205 | Fair 14.4% |
| Scandinavians | 23.3 /100 | #206 | Fair 14.4% |
| Immigrants | Bosnia and Herzegovina | 22.0 /100 | #207 | Fair 14.3% |
| Immigrants | Barbados | 20.5 /100 | #208 | Fair 14.3% |
| Immigrants | Panama | 20.0 /100 | #209 | Fair 14.3% |
| Sub-Saharan Africans | 19.4 /100 | #210 | Poor 14.2% |
| Somalis | 18.0 /100 | #211 | Poor 14.2% |
| Spanish | 17.8 /100 | #212 | Poor 14.2% |
| Immigrants | Thailand | 17.0 /100 | #213 | Poor 14.2% |
| Finns | 16.9 /100 | #214 | Poor 14.2% |
| Immigrants | Vietnam | 16.1 /100 | #215 | Poor 14.1% |
| Immigrants | Somalia | 15.8 /100 | #216 | Poor 14.1% |
| Immigrants | Trinidad and Tobago | 15.8 /100 | #217 | Poor 14.1% |