American vs Immigrants from Chile Disability
COMPARE
American
Immigrants from Chile
Disability
Disability Comparison
Americans
Immigrants from Chile
13.9%
DISABILITY
0.0/ 100
METRIC RATING
322nd/ 347
METRIC RANK
11.0%
DISABILITY
99.4/ 100
METRIC RATING
72nd/ 347
METRIC RANK
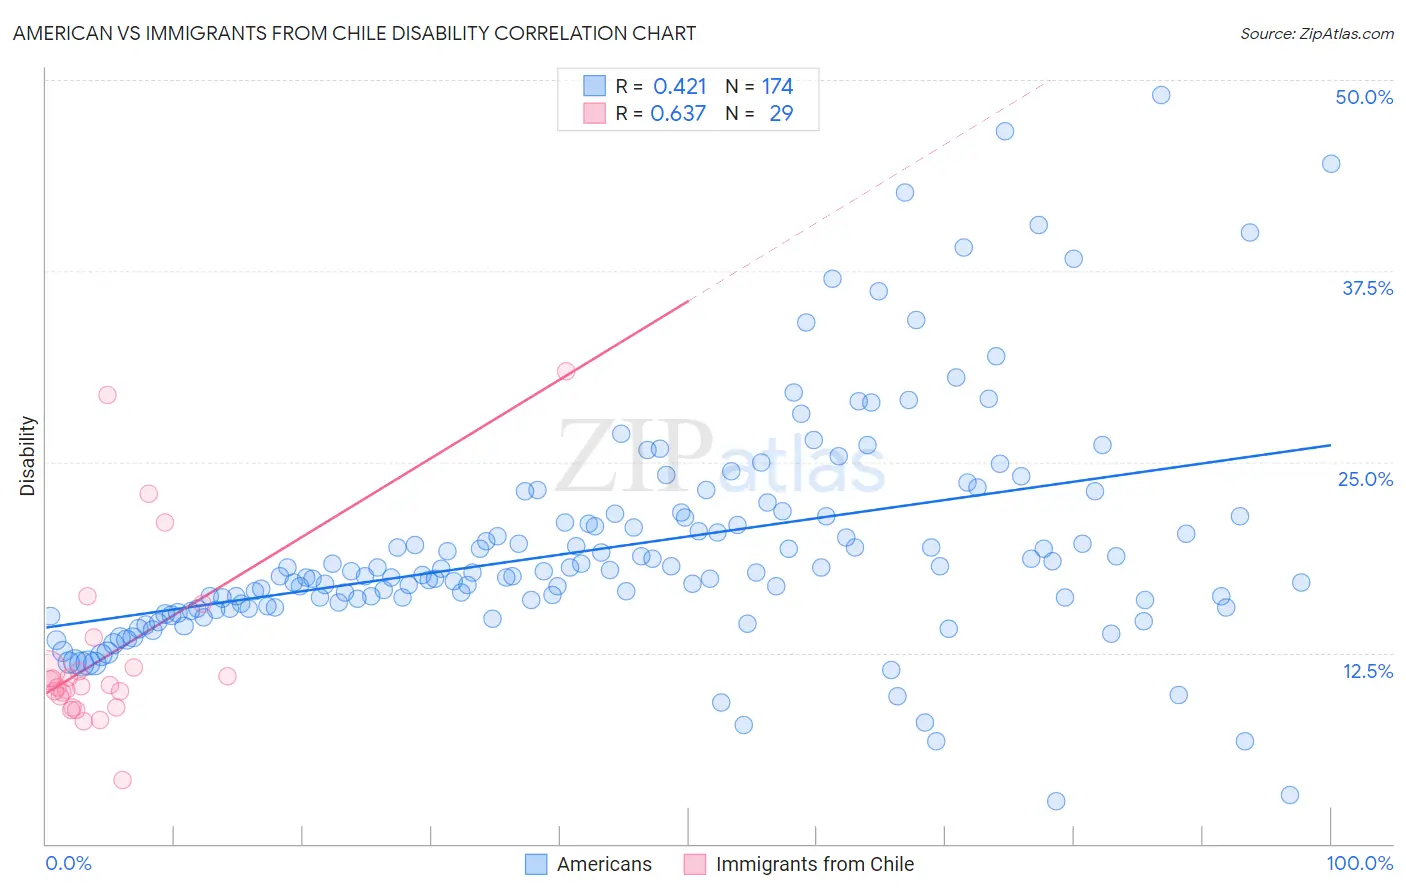
American vs Immigrants from Chile Disability Correlation Chart
The statistical analysis conducted on geographies consisting of 581,794,262 people shows a moderate positive correlation between the proportion of Americans and percentage of population with a disability in the United States with a correlation coefficient (R) of 0.421 and weighted average of 13.9%. Similarly, the statistical analysis conducted on geographies consisting of 218,638,436 people shows a significant positive correlation between the proportion of Immigrants from Chile and percentage of population with a disability in the United States with a correlation coefficient (R) of 0.637 and weighted average of 11.0%, a difference of 26.2%.
Disability Correlation Summary
| Measurement | American | Immigrants from Chile |
| Minimum | 2.8% | 4.2% |
| Maximum | 49.1% | 31.0% |
| Range | 46.3% | 26.8% |
| Mean | 19.4% | 12.5% |
| Median | 17.7% | 10.4% |
| Interquartile 25% (IQ1) | 15.4% | 9.3% |
| Interquartile 75% (IQ3) | 21.4% | 12.5% |
| Interquartile Range (IQR) | 6.0% | 3.2% |
| Standard Deviation (Sample) | 7.5% | 6.1% |
| Standard Deviation (Population) | 7.5% | 6.0% |
Similar Demographics by Disability
Demographics Similar to Americans by Disability
In terms of disability, the demographic groups most similar to Americans are Paiute (13.9%, a difference of 0.42%), Apache (13.9%, a difference of 0.55%), Iroquois (13.8%, a difference of 0.84%), Menominee (13.8%, a difference of 1.1%), and Comanche (14.1%, a difference of 1.3%).
| Demographics | Rating | Rank | Disability |
| Puget Sound Salish | 0.0 /100 | #315 | Tragic 13.7% |
| Pima | 0.0 /100 | #316 | Tragic 13.7% |
| Immigrants | Cabo Verde | 0.0 /100 | #317 | Tragic 13.7% |
| Menominee | 0.0 /100 | #318 | Tragic 13.8% |
| Iroquois | 0.0 /100 | #319 | Tragic 13.8% |
| Apache | 0.0 /100 | #320 | Tragic 13.9% |
| Paiute | 0.0 /100 | #321 | Tragic 13.9% |
| Americans | 0.0 /100 | #322 | Tragic 13.9% |
| Comanche | 0.0 /100 | #323 | Tragic 14.1% |
| Chippewa | 0.0 /100 | #324 | Tragic 14.1% |
| Natives/Alaskans | 0.0 /100 | #325 | Tragic 14.2% |
| Osage | 0.0 /100 | #326 | Tragic 14.2% |
| Ottawa | 0.0 /100 | #327 | Tragic 14.2% |
| Immigrants | Azores | 0.0 /100 | #328 | Tragic 14.2% |
| Potawatomi | 0.0 /100 | #329 | Tragic 14.2% |
Demographics Similar to Immigrants from Chile by Disability
In terms of disability, the demographic groups most similar to Immigrants from Chile are Immigrants from Bangladesh (11.0%, a difference of 0.030%), Immigrants from Serbia (11.0%, a difference of 0.040%), Immigrants from Vietnam (11.0%, a difference of 0.070%), Immigrants from Lebanon (11.0%, a difference of 0.090%), and Sierra Leonean (11.0%, a difference of 0.090%).
| Demographics | Rating | Rank | Disability |
| Bulgarians | 99.6 /100 | #65 | Exceptional 11.0% |
| Laotians | 99.6 /100 | #66 | Exceptional 11.0% |
| Colombians | 99.6 /100 | #67 | Exceptional 11.0% |
| Immigrants | Afghanistan | 99.6 /100 | #68 | Exceptional 11.0% |
| Sri Lankans | 99.5 /100 | #69 | Exceptional 11.0% |
| Immigrants | France | 99.4 /100 | #70 | Exceptional 11.0% |
| Immigrants | Lebanon | 99.4 /100 | #71 | Exceptional 11.0% |
| Immigrants | Chile | 99.4 /100 | #72 | Exceptional 11.0% |
| Immigrants | Bangladesh | 99.4 /100 | #73 | Exceptional 11.0% |
| Immigrants | Serbia | 99.4 /100 | #74 | Exceptional 11.0% |
| Immigrants | Vietnam | 99.4 /100 | #75 | Exceptional 11.0% |
| Sierra Leoneans | 99.3 /100 | #76 | Exceptional 11.0% |
| Immigrants | Belgium | 99.3 /100 | #77 | Exceptional 11.0% |
| Immigrants | Cameroon | 99.3 /100 | #78 | Exceptional 11.1% |
| Immigrants | Jordan | 99.3 /100 | #79 | Exceptional 11.1% |