Immigrants from Norway vs Immigrants from Chile Median Household Income
COMPARE
Immigrants from Norway
Immigrants from Chile
Median Household Income
Median Household Income Comparison
Immigrants from Norway
Immigrants from Chile
$94,846
MEDIAN HOUSEHOLD INCOME
99.8/ 100
METRIC RATING
62nd/ 347
METRIC RANK
$88,388
MEDIAN HOUSEHOLD INCOME
89.2/ 100
METRIC RATING
139th/ 347
METRIC RANK
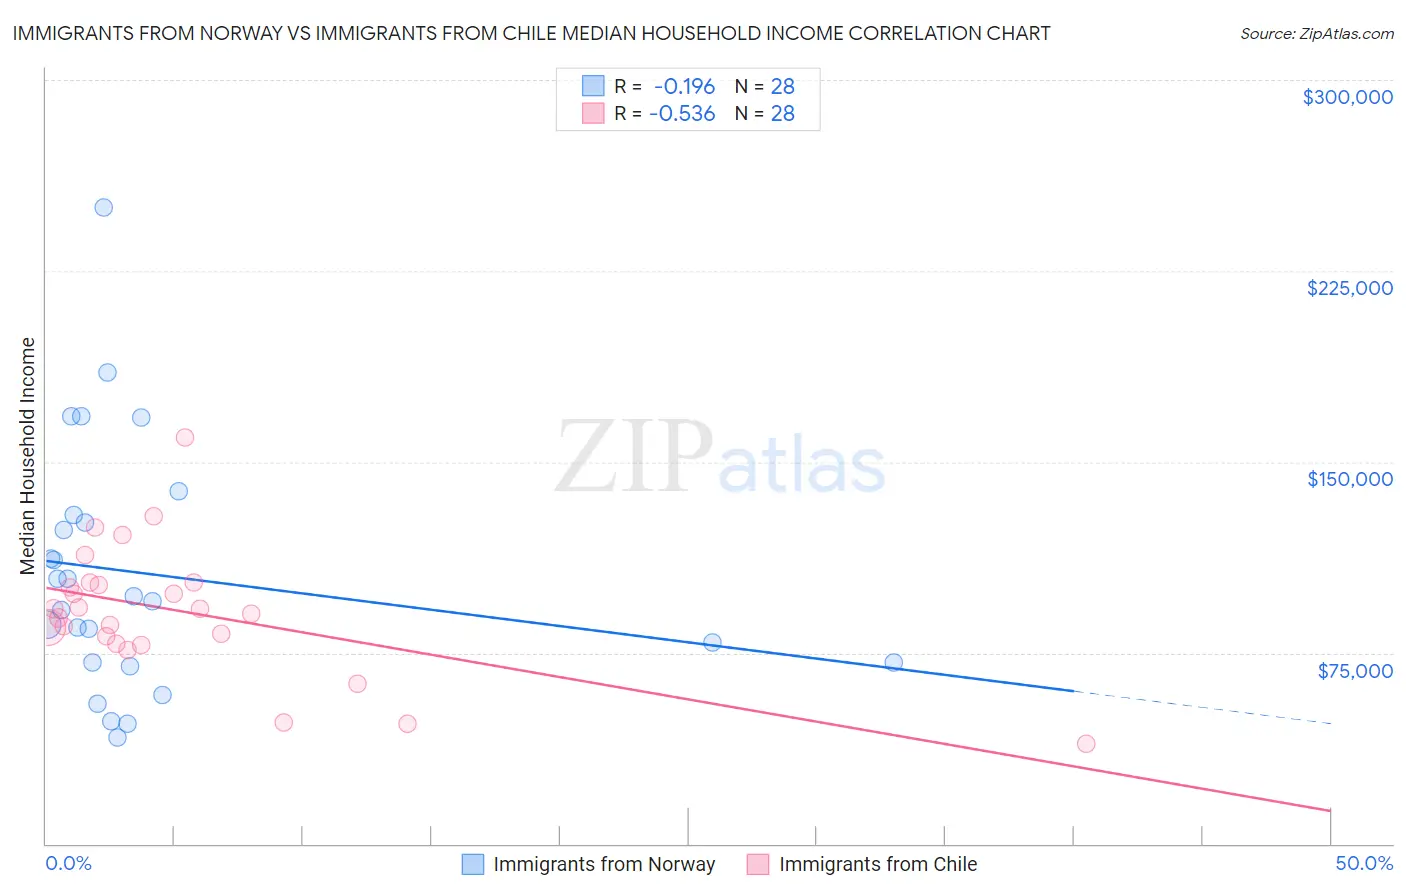
Immigrants from Norway vs Immigrants from Chile Median Household Income Correlation Chart
The statistical analysis conducted on geographies consisting of 116,683,199 people shows a poor negative correlation between the proportion of Immigrants from Norway and median household income in the United States with a correlation coefficient (R) of -0.196 and weighted average of $94,846. Similarly, the statistical analysis conducted on geographies consisting of 218,579,752 people shows a substantial negative correlation between the proportion of Immigrants from Chile and median household income in the United States with a correlation coefficient (R) of -0.536 and weighted average of $88,388, a difference of 7.3%.
Median Household Income Correlation Summary
| Measurement | Immigrants from Norway | Immigrants from Chile |
| Minimum | $41,875 | $39,375 |
| Maximum | $250,001 | $159,688 |
| Range | $208,126 | $120,313 |
| Mean | $106,024 | $91,361 |
| Median | $96,218 | $91,251 |
| Interquartile 25% (IQ1) | $71,155 | $80,247 |
| Interquartile 75% (IQ3) | $127,785 | $102,116 |
| Interquartile Range (IQR) | $56,630 | $21,868 |
| Standard Deviation (Sample) | $48,243 | $25,347 |
| Standard Deviation (Population) | $47,374 | $24,890 |
Similar Demographics by Median Household Income
Demographics Similar to Immigrants from Norway by Median Household Income
In terms of median household income, the demographic groups most similar to Immigrants from Norway are Greek ($94,735, a difference of 0.12%), Laotian ($94,990, a difference of 0.15%), Korean ($95,018, a difference of 0.18%), Immigrants from Europe ($95,032, a difference of 0.20%), and Soviet Union ($95,098, a difference of 0.27%).
| Demographics | Rating | Rank | Median Household Income |
| Immigrants | Czechoslovakia | 99.9 /100 | #55 | Exceptional $95,319 |
| Immigrants | Austria | 99.9 /100 | #56 | Exceptional $95,277 |
| New Zealanders | 99.8 /100 | #57 | Exceptional $95,146 |
| Soviet Union | 99.8 /100 | #58 | Exceptional $95,098 |
| Immigrants | Europe | 99.8 /100 | #59 | Exceptional $95,032 |
| Koreans | 99.8 /100 | #60 | Exceptional $95,018 |
| Laotians | 99.8 /100 | #61 | Exceptional $94,990 |
| Immigrants | Norway | 99.8 /100 | #62 | Exceptional $94,846 |
| Greeks | 99.8 /100 | #63 | Exceptional $94,735 |
| Immigrants | Netherlands | 99.7 /100 | #64 | Exceptional $94,411 |
| Immigrants | Belarus | 99.7 /100 | #65 | Exceptional $94,399 |
| Immigrants | Romania | 99.7 /100 | #66 | Exceptional $94,222 |
| Immigrants | Scotland | 99.7 /100 | #67 | Exceptional $94,091 |
| Mongolians | 99.7 /100 | #68 | Exceptional $93,971 |
| Argentineans | 99.7 /100 | #69 | Exceptional $93,960 |
Demographics Similar to Immigrants from Chile by Median Household Income
In terms of median household income, the demographic groups most similar to Immigrants from Chile are Arab ($88,398, a difference of 0.010%), Sierra Leonean ($88,463, a difference of 0.080%), Polish ($88,472, a difference of 0.090%), Immigrants from Sierra Leone ($88,498, a difference of 0.12%), and Swedish ($88,524, a difference of 0.15%).
| Demographics | Rating | Rank | Median Household Income |
| Europeans | 91.2 /100 | #132 | Exceptional $88,751 |
| Immigrants | Ethiopia | 90.9 /100 | #133 | Exceptional $88,687 |
| Swedes | 90.0 /100 | #134 | Exceptional $88,524 |
| Immigrants | Sierra Leone | 89.9 /100 | #135 | Excellent $88,498 |
| Poles | 89.7 /100 | #136 | Excellent $88,472 |
| Sierra Leoneans | 89.6 /100 | #137 | Excellent $88,463 |
| Arabs | 89.2 /100 | #138 | Excellent $88,398 |
| Immigrants | Chile | 89.2 /100 | #139 | Excellent $88,388 |
| Lebanese | 87.2 /100 | #140 | Excellent $88,091 |
| Immigrants | Morocco | 86.0 /100 | #141 | Excellent $87,930 |
| Canadians | 84.7 /100 | #142 | Excellent $87,769 |
| Danes | 83.9 /100 | #143 | Excellent $87,676 |
| Serbians | 83.0 /100 | #144 | Excellent $87,572 |
| Ugandans | 82.9 /100 | #145 | Excellent $87,557 |
| Immigrants | Uganda | 82.8 /100 | #146 | Excellent $87,553 |