Immigrants from Norway vs Venezuelan Disability Age Under 5
COMPARE
Immigrants from Norway
Venezuelan
Disability Age Under 5
Disability Age Under 5 Comparison
Immigrants from Norway
Venezuelans
1.3%
DISABILITY AGE UNDER 5
31.1/ 100
METRIC RATING
198th/ 347
METRIC RANK
1.2%
DISABILITY AGE UNDER 5
47.1/ 100
METRIC RATING
178th/ 347
METRIC RANK
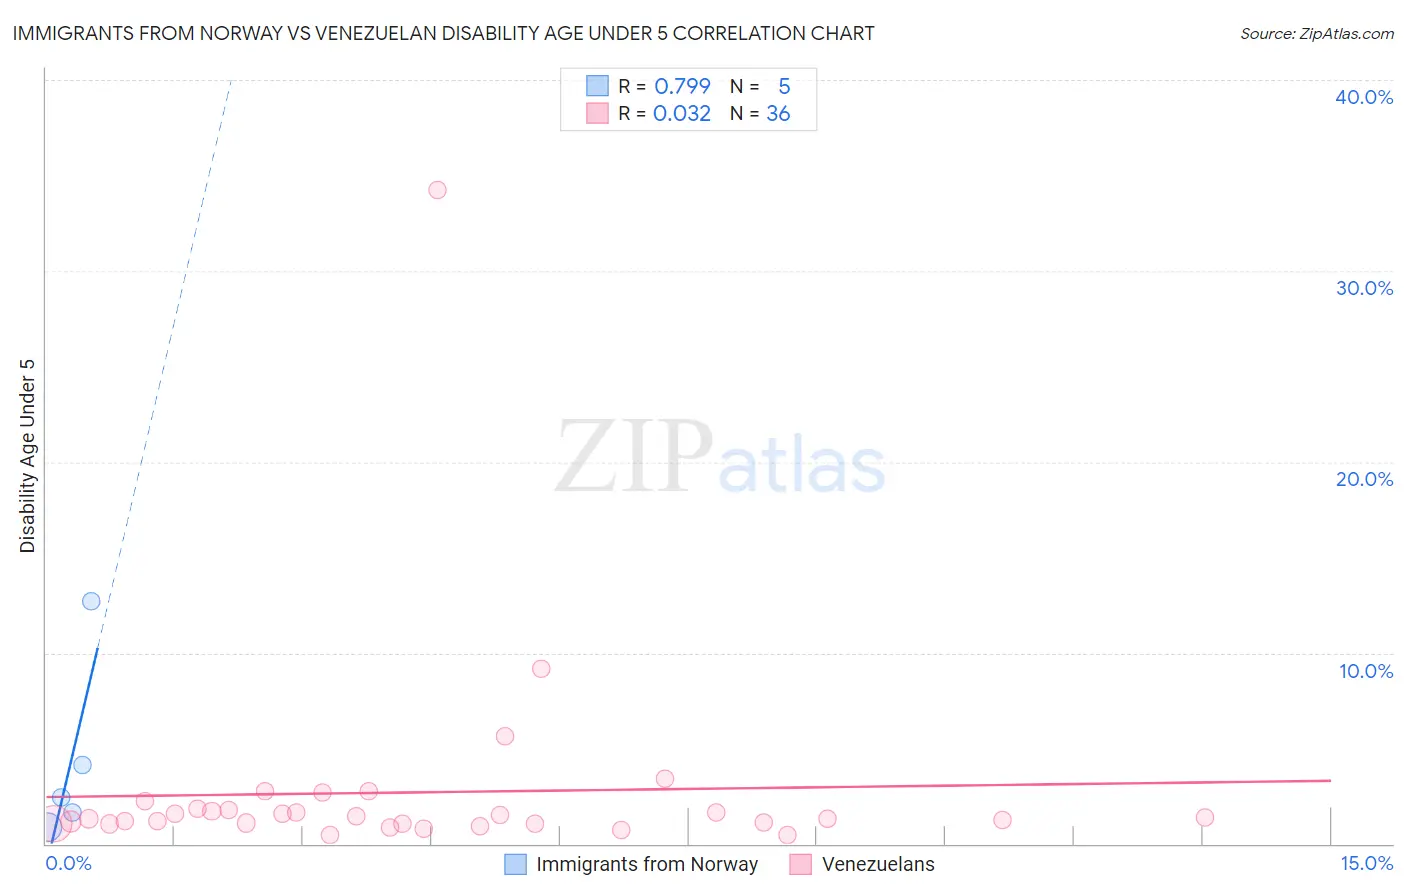
Immigrants from Norway vs Venezuelan Disability Age Under 5 Correlation Chart
The statistical analysis conducted on geographies consisting of 84,343,493 people shows a strong positive correlation between the proportion of Immigrants from Norway and percentage of population with a disability under the age of 5 in the United States with a correlation coefficient (R) of 0.799 and weighted average of 1.3%. Similarly, the statistical analysis conducted on geographies consisting of 181,706,863 people shows no correlation between the proportion of Venezuelans and percentage of population with a disability under the age of 5 in the United States with a correlation coefficient (R) of 0.032 and weighted average of 1.2%, a difference of 1.5%.
Disability Age Under 5 Correlation Summary
| Measurement | Immigrants from Norway | Venezuelan |
| Minimum | 0.87% | 0.44% |
| Maximum | 12.7% | 34.2% |
| Range | 11.8% | 33.8% |
| Mean | 4.3% | 2.7% |
| Median | 2.4% | 1.4% |
| Interquartile 25% (IQ1) | 1.2% | 1.0% |
| Interquartile 75% (IQ3) | 8.4% | 1.8% |
| Interquartile Range (IQR) | 7.2% | 0.76% |
| Standard Deviation (Sample) | 4.8% | 5.6% |
| Standard Deviation (Population) | 4.3% | 5.6% |
Demographics Similar to Immigrants from Norway and Venezuelans by Disability Age Under 5
In terms of disability age under 5, the demographic groups most similar to Immigrants from Norway are Immigrants from Somalia (1.3%, a difference of 0.030%), Immigrants from Belgium (1.3%, a difference of 0.040%), U.S. Virgin Islander (1.3%, a difference of 0.34%), Immigrants from North Macedonia (1.3%, a difference of 0.37%), and Immigrants from Sierra Leone (1.3%, a difference of 0.54%). Similarly, the demographic groups most similar to Venezuelans are Immigrants from Bahamas (1.2%, a difference of 0.17%), Immigrants from Mexico (1.2%, a difference of 0.24%), Immigrants from Peru (1.2%, a difference of 0.30%), Macedonian (1.2%, a difference of 0.30%), and Immigrants from Saudi Arabia (1.2%, a difference of 0.34%).
| Demographics | Rating | Rank | Disability Age Under 5 |
| Venezuelans | 47.1 /100 | #178 | Average 1.2% |
| Immigrants | Bahamas | 45.2 /100 | #179 | Average 1.2% |
| Immigrants | Mexico | 44.4 /100 | #180 | Average 1.2% |
| Immigrants | Peru | 43.7 /100 | #181 | Average 1.2% |
| Macedonians | 43.7 /100 | #181 | Average 1.2% |
| Immigrants | Saudi Arabia | 43.3 /100 | #183 | Average 1.2% |
| Palestinians | 43.0 /100 | #184 | Average 1.2% |
| Immigrants | Western Africa | 42.5 /100 | #185 | Average 1.2% |
| Cubans | 42.5 /100 | #186 | Average 1.2% |
| Immigrants | Haiti | 40.2 /100 | #187 | Average 1.3% |
| Haitians | 39.9 /100 | #188 | Fair 1.3% |
| Peruvians | 37.6 /100 | #189 | Fair 1.3% |
| Immigrants | Laos | 36.6 /100 | #190 | Fair 1.3% |
| Mexican American Indians | 36.6 /100 | #191 | Fair 1.3% |
| Immigrants | Bosnia and Herzegovina | 36.5 /100 | #192 | Fair 1.3% |
| Immigrants | Sierra Leone | 36.5 /100 | #193 | Fair 1.3% |
| Immigrants | North Macedonia | 34.7 /100 | #194 | Fair 1.3% |
| U.S. Virgin Islanders | 34.4 /100 | #195 | Fair 1.3% |
| Immigrants | Belgium | 31.4 /100 | #196 | Fair 1.3% |
| Immigrants | Somalia | 31.3 /100 | #197 | Fair 1.3% |
| Immigrants | Norway | 31.1 /100 | #198 | Fair 1.3% |