Immigrants from Norway vs Afghan Average Family Size
COMPARE
Immigrants from Norway
Afghan
Average Family Size
Average Family Size Comparison
Immigrants from Norway
Afghans
3.14
AVERAGE FAMILY SIZE
0.3/ 100
METRIC RATING
289th/ 347
METRIC RANK
3.31
AVERAGE FAMILY SIZE
99.7/ 100
METRIC RATING
85th/ 347
METRIC RANK
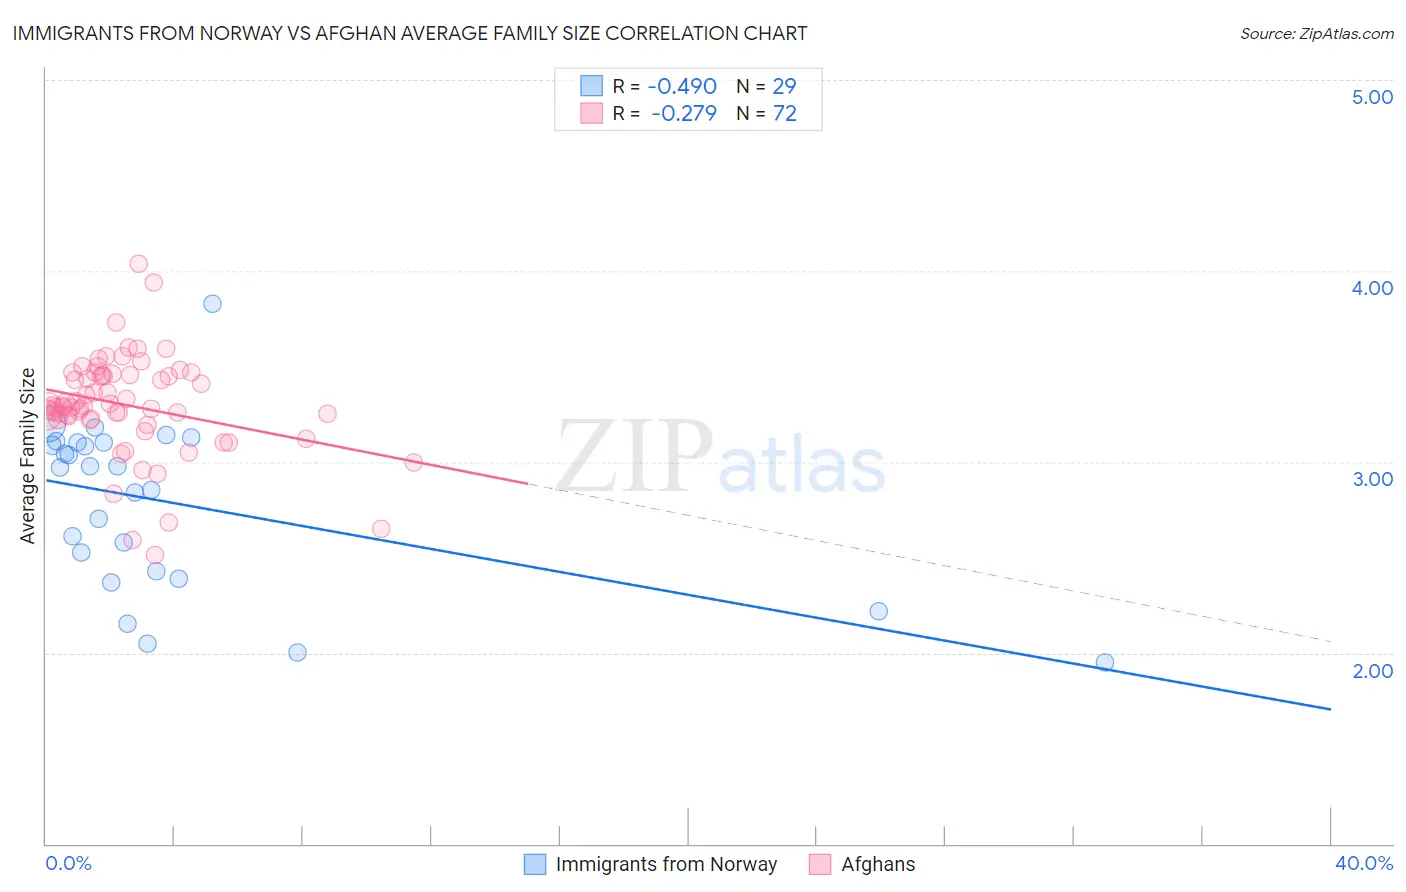
Immigrants from Norway vs Afghan Average Family Size Correlation Chart
The statistical analysis conducted on geographies consisting of 116,686,104 people shows a moderate negative correlation between the proportion of Immigrants from Norway and average family size in the United States with a correlation coefficient (R) of -0.490 and weighted average of 3.14. Similarly, the statistical analysis conducted on geographies consisting of 148,832,546 people shows a weak negative correlation between the proportion of Afghans and average family size in the United States with a correlation coefficient (R) of -0.279 and weighted average of 3.31, a difference of 5.5%.
Average Family Size Correlation Summary
| Measurement | Immigrants from Norway | Afghan |
| Minimum | 1.95 | 2.51 |
| Maximum | 3.83 | 4.04 |
| Range | 1.88 | 1.53 |
| Mean | 2.78 | 3.30 |
| Median | 2.97 | 3.29 |
| Interquartile 25% (IQ1) | 2.41 | 3.22 |
| Interquartile 75% (IQ3) | 3.10 | 3.46 |
| Interquartile Range (IQR) | 0.69 | 0.23 |
| Standard Deviation (Sample) | 0.45 | 0.26 |
| Standard Deviation (Population) | 0.44 | 0.26 |
Similar Demographics by Average Family Size
Demographics Similar to Immigrants from Norway by Average Family Size
In terms of average family size, the demographic groups most similar to Immigrants from Norway are Greek (3.14, a difference of 0.0%), Immigrants from Czechoslovakia (3.14, a difference of 0.0%), Immigrants from Netherlands (3.14, a difference of 0.010%), Cypriot (3.14, a difference of 0.030%), and White/Caucasian (3.14, a difference of 0.060%).
| Demographics | Rating | Rank | Average Family Size |
| Yugoslavians | 0.4 /100 | #282 | Tragic 3.15 |
| German Russians | 0.4 /100 | #283 | Tragic 3.15 |
| Immigrants | France | 0.4 /100 | #284 | Tragic 3.15 |
| Whites/Caucasians | 0.3 /100 | #285 | Tragic 3.14 |
| Immigrants | Netherlands | 0.3 /100 | #286 | Tragic 3.14 |
| Greeks | 0.3 /100 | #287 | Tragic 3.14 |
| Immigrants | Czechoslovakia | 0.3 /100 | #288 | Tragic 3.14 |
| Immigrants | Norway | 0.3 /100 | #289 | Tragic 3.14 |
| Cypriots | 0.3 /100 | #290 | Tragic 3.14 |
| Alsatians | 0.2 /100 | #291 | Tragic 3.14 |
| Europeans | 0.2 /100 | #292 | Tragic 3.14 |
| Scandinavians | 0.2 /100 | #293 | Tragic 3.14 |
| Immigrants | Croatia | 0.2 /100 | #294 | Tragic 3.14 |
| Austrians | 0.2 /100 | #295 | Tragic 3.14 |
| Ukrainians | 0.2 /100 | #296 | Tragic 3.14 |
Demographics Similar to Afghans by Average Family Size
In terms of average family size, the demographic groups most similar to Afghans are Jamaican (3.31, a difference of 0.020%), Immigrants from Nigeria (3.32, a difference of 0.040%), Immigrants from Peru (3.31, a difference of 0.070%), Immigrants from Afghanistan (3.32, a difference of 0.080%), and Ecuadorian (3.32, a difference of 0.090%).
| Demographics | Rating | Rank | Average Family Size |
| Immigrants | Micronesia | 99.8 /100 | #78 | Exceptional 3.32 |
| British West Indians | 99.8 /100 | #79 | Exceptional 3.32 |
| Lumbee | 99.8 /100 | #80 | Exceptional 3.32 |
| Immigrants | Dominica | 99.8 /100 | #81 | Exceptional 3.32 |
| Ecuadorians | 99.8 /100 | #82 | Exceptional 3.32 |
| Immigrants | Afghanistan | 99.8 /100 | #83 | Exceptional 3.32 |
| Immigrants | Nigeria | 99.7 /100 | #84 | Exceptional 3.32 |
| Afghans | 99.7 /100 | #85 | Exceptional 3.31 |
| Jamaicans | 99.7 /100 | #86 | Exceptional 3.31 |
| Immigrants | Peru | 99.7 /100 | #87 | Exceptional 3.31 |
| Immigrants | Bolivia | 99.6 /100 | #88 | Exceptional 3.31 |
| Malaysians | 99.6 /100 | #89 | Exceptional 3.31 |
| Menominee | 99.4 /100 | #90 | Exceptional 3.30 |
| Immigrants | Pakistan | 99.2 /100 | #91 | Exceptional 3.30 |
| Immigrants | Cameroon | 99.2 /100 | #92 | Exceptional 3.30 |