Immigrants from Norway vs Ugandan Disability Age Under 5
COMPARE
Immigrants from Norway
Ugandan
Disability Age Under 5
Disability Age Under 5 Comparison
Immigrants from Norway
Ugandans
1.3%
DISABILITY AGE UNDER 5
31.1/ 100
METRIC RATING
198th/ 347
METRIC RANK
1.1%
DISABILITY AGE UNDER 5
97.5/ 100
METRIC RATING
87th/ 347
METRIC RANK
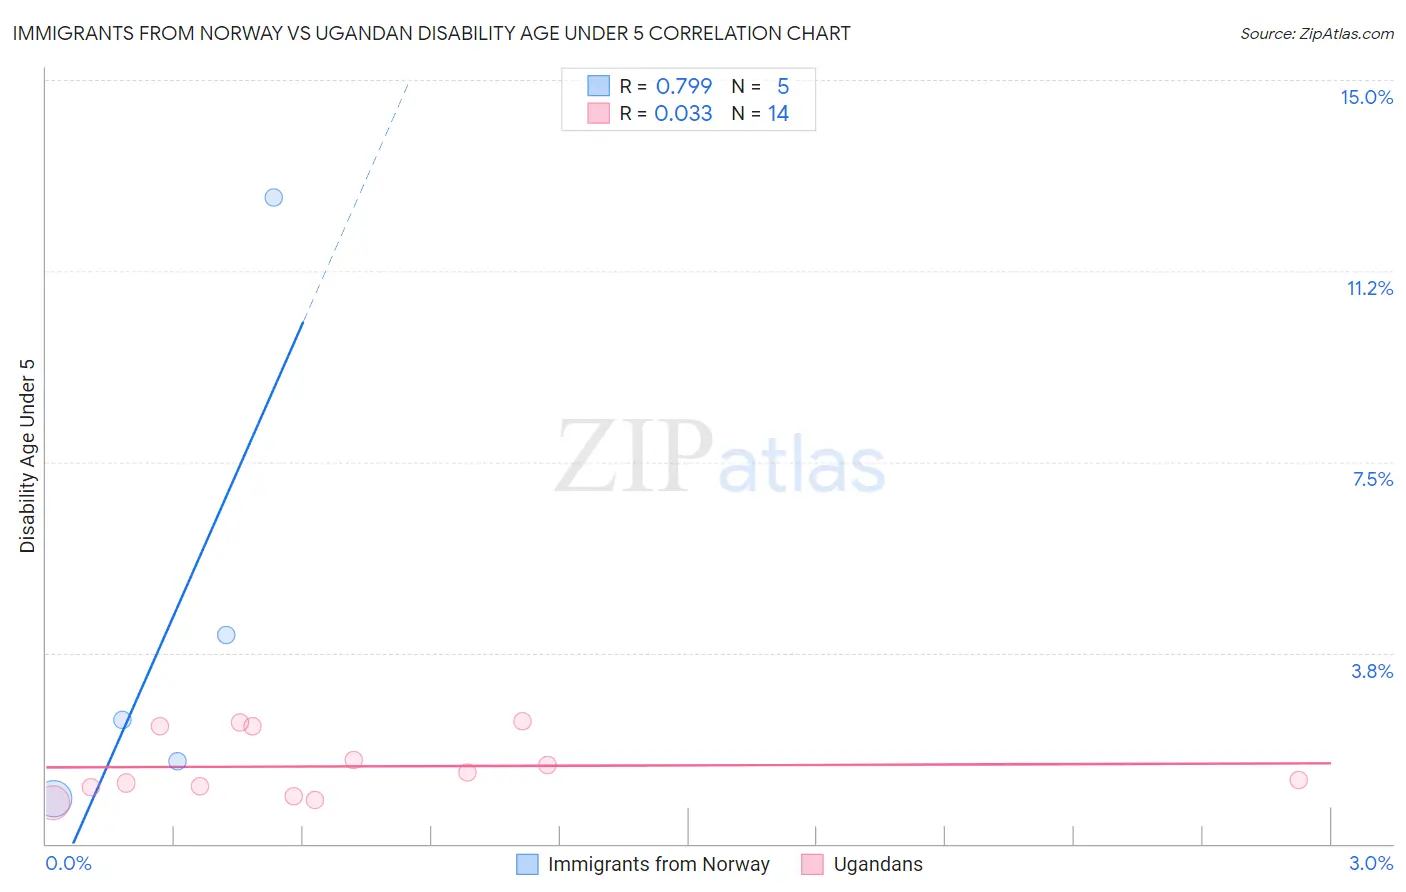
Immigrants from Norway vs Ugandan Disability Age Under 5 Correlation Chart
The statistical analysis conducted on geographies consisting of 84,343,493 people shows a strong positive correlation between the proportion of Immigrants from Norway and percentage of population with a disability under the age of 5 in the United States with a correlation coefficient (R) of 0.799 and weighted average of 1.3%. Similarly, the statistical analysis conducted on geographies consisting of 75,065,074 people shows no correlation between the proportion of Ugandans and percentage of population with a disability under the age of 5 in the United States with a correlation coefficient (R) of 0.033 and weighted average of 1.1%, a difference of 11.1%.
Disability Age Under 5 Correlation Summary
| Measurement | Immigrants from Norway | Ugandan |
| Minimum | 0.87% | 0.80% |
| Maximum | 12.7% | 2.4% |
| Range | 11.8% | 1.6% |
| Mean | 4.3% | 1.5% |
| Median | 2.4% | 1.3% |
| Interquartile 25% (IQ1) | 1.2% | 1.1% |
| Interquartile 75% (IQ3) | 8.4% | 2.3% |
| Interquartile Range (IQR) | 7.2% | 1.2% |
| Standard Deviation (Sample) | 4.8% | 0.59% |
| Standard Deviation (Population) | 4.3% | 0.57% |
Similar Demographics by Disability Age Under 5
Demographics Similar to Immigrants from Norway by Disability Age Under 5
In terms of disability age under 5, the demographic groups most similar to Immigrants from Norway are Immigrants from Somalia (1.3%, a difference of 0.030%), Immigrants from Belgium (1.3%, a difference of 0.040%), Jamaican (1.3%, a difference of 0.040%), U.S. Virgin Islander (1.3%, a difference of 0.34%), and Immigrants from North Macedonia (1.3%, a difference of 0.37%).
| Demographics | Rating | Rank | Disability Age Under 5 |
| Mexican American Indians | 36.6 /100 | #191 | Fair 1.3% |
| Immigrants | Bosnia and Herzegovina | 36.5 /100 | #192 | Fair 1.3% |
| Immigrants | Sierra Leone | 36.5 /100 | #193 | Fair 1.3% |
| Immigrants | North Macedonia | 34.7 /100 | #194 | Fair 1.3% |
| U.S. Virgin Islanders | 34.4 /100 | #195 | Fair 1.3% |
| Immigrants | Belgium | 31.4 /100 | #196 | Fair 1.3% |
| Immigrants | Somalia | 31.3 /100 | #197 | Fair 1.3% |
| Immigrants | Norway | 31.1 /100 | #198 | Fair 1.3% |
| Jamaicans | 30.7 /100 | #199 | Fair 1.3% |
| Immigrants | Lithuania | 27.2 /100 | #200 | Fair 1.3% |
| Immigrants | Italy | 25.4 /100 | #201 | Fair 1.3% |
| Arapaho | 24.1 /100 | #202 | Fair 1.3% |
| Liberians | 24.0 /100 | #203 | Fair 1.3% |
| Immigrants | Europe | 23.6 /100 | #204 | Fair 1.3% |
| Romanians | 22.5 /100 | #205 | Fair 1.3% |
Demographics Similar to Ugandans by Disability Age Under 5
In terms of disability age under 5, the demographic groups most similar to Ugandans are Okinawan (1.1%, a difference of 0.020%), Immigrants from Dominican Republic (1.1%, a difference of 0.020%), Sudanese (1.1%, a difference of 0.14%), Immigrants from Zaire (1.1%, a difference of 0.22%), and Ethiopian (1.1%, a difference of 0.31%).
| Demographics | Rating | Rank | Disability Age Under 5 |
| Immigrants | Trinidad and Tobago | 98.0 /100 | #80 | Exceptional 1.1% |
| Turks | 98.0 /100 | #81 | Exceptional 1.1% |
| Immigrants | Jordan | 97.9 /100 | #82 | Exceptional 1.1% |
| Immigrants | Syria | 97.9 /100 | #83 | Exceptional 1.1% |
| Immigrants | Zaire | 97.8 /100 | #84 | Exceptional 1.1% |
| Sudanese | 97.7 /100 | #85 | Exceptional 1.1% |
| Okinawans | 97.6 /100 | #86 | Exceptional 1.1% |
| Ugandans | 97.5 /100 | #87 | Exceptional 1.1% |
| Immigrants | Dominican Republic | 97.5 /100 | #88 | Exceptional 1.1% |
| Ethiopians | 97.2 /100 | #89 | Exceptional 1.1% |
| Chinese | 97.2 /100 | #90 | Exceptional 1.1% |
| Albanians | 97.2 /100 | #91 | Exceptional 1.1% |
| Immigrants | Cuba | 97.0 /100 | #92 | Exceptional 1.1% |
| Spanish Americans | 96.9 /100 | #93 | Exceptional 1.1% |
| Sri Lankans | 96.8 /100 | #94 | Exceptional 1.1% |