Immigrants from Norway vs Afghan In Labor Force | Age 45-54
COMPARE
Immigrants from Norway
Afghan
In Labor Force | Age 45-54
In Labor Force | Age 45-54 Comparison
Immigrants from Norway
Afghans
82.5%
IN LABOR FORCE | AGE 45-54
20.7/ 100
METRIC RATING
194th/ 347
METRIC RANK
83.5%
IN LABOR FORCE | AGE 45-54
97.9/ 100
METRIC RATING
63rd/ 347
METRIC RANK
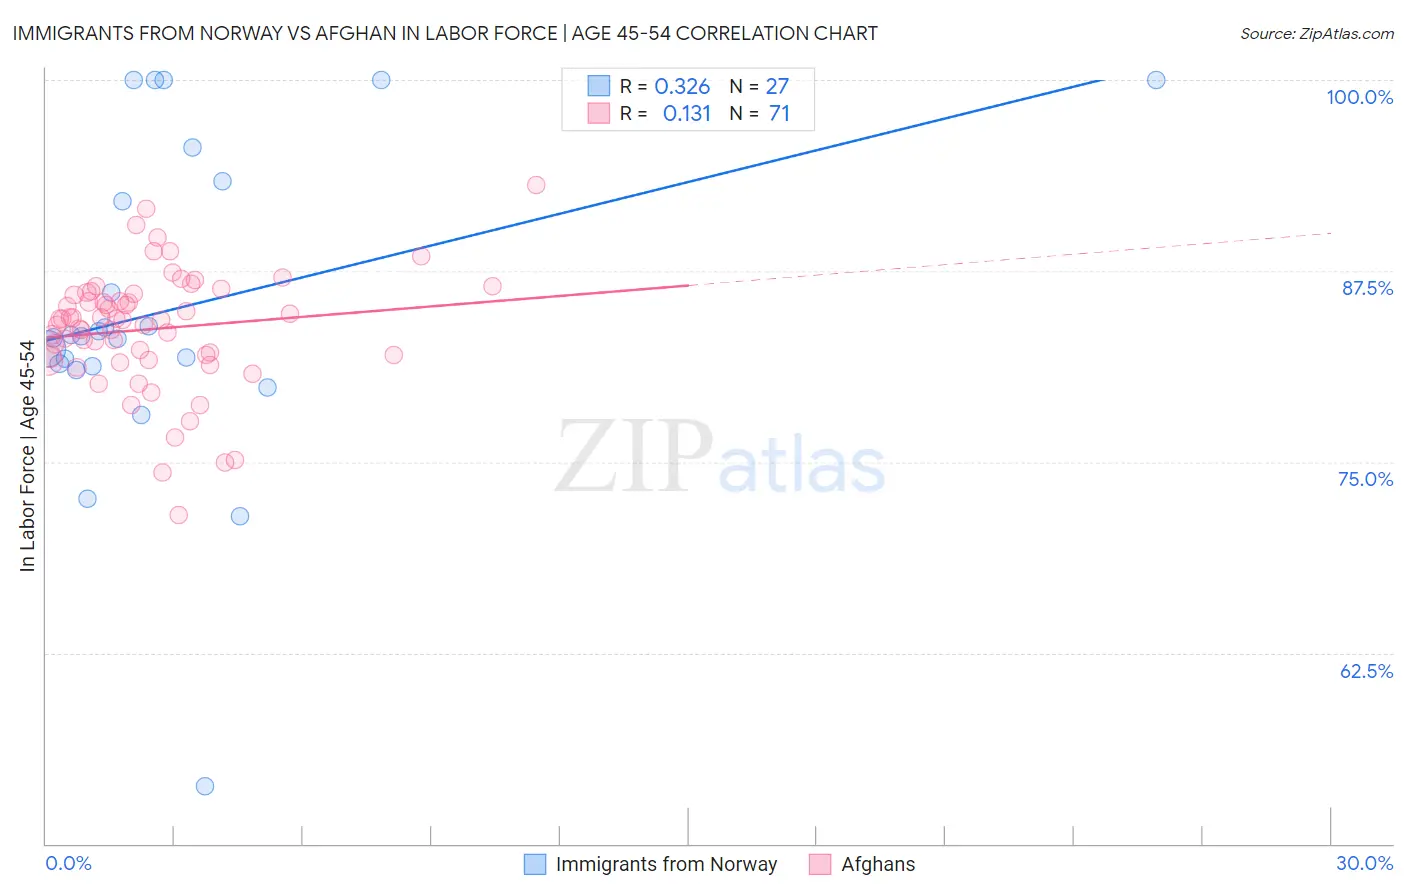
Immigrants from Norway vs Afghan In Labor Force | Age 45-54 Correlation Chart
The statistical analysis conducted on geographies consisting of 116,685,095 people shows a mild positive correlation between the proportion of Immigrants from Norway and labor force participation rate among population between the ages 45 and 54 in the United States with a correlation coefficient (R) of 0.326 and weighted average of 82.5%. Similarly, the statistical analysis conducted on geographies consisting of 148,803,008 people shows a poor positive correlation between the proportion of Afghans and labor force participation rate among population between the ages 45 and 54 in the United States with a correlation coefficient (R) of 0.131 and weighted average of 83.5%, a difference of 1.1%.
In Labor Force | Age 45-54 Correlation Summary
| Measurement | Immigrants from Norway | Afghan |
| Minimum | 53.8% | 71.5% |
| Maximum | 100.0% | 93.1% |
| Range | 46.2% | 21.6% |
| Mean | 85.1% | 83.7% |
| Median | 83.2% | 84.3% |
| Interquartile 25% (IQ1) | 81.3% | 81.9% |
| Interquartile 75% (IQ3) | 93.4% | 86.0% |
| Interquartile Range (IQR) | 12.1% | 4.1% |
| Standard Deviation (Sample) | 10.4% | 3.9% |
| Standard Deviation (Population) | 10.2% | 3.8% |
Similar Demographics by In Labor Force | Age 45-54
Demographics Similar to Immigrants from Norway by In Labor Force | Age 45-54
In terms of in labor force | age 45-54, the demographic groups most similar to Immigrants from Norway are Immigrants from Iraq (82.5%, a difference of 0.0%), Australian (82.5%, a difference of 0.0%), Immigrants from Canada (82.5%, a difference of 0.010%), Armenian (82.5%, a difference of 0.030%), and Immigrants from North America (82.5%, a difference of 0.030%).
| Demographics | Rating | Rank | In Labor Force | Age 45-54 |
| Immigrants | Costa Rica | 28.3 /100 | #187 | Fair 82.6% |
| South Africans | 28.0 /100 | #188 | Fair 82.6% |
| Syrians | 26.0 /100 | #189 | Fair 82.6% |
| British | 25.7 /100 | #190 | Fair 82.6% |
| Armenians | 23.2 /100 | #191 | Fair 82.5% |
| Immigrants | Iraq | 20.9 /100 | #192 | Fair 82.5% |
| Australians | 20.8 /100 | #193 | Fair 82.5% |
| Immigrants | Norway | 20.7 /100 | #194 | Fair 82.5% |
| Immigrants | Canada | 20.0 /100 | #195 | Fair 82.5% |
| Immigrants | North America | 18.8 /100 | #196 | Poor 82.5% |
| Lebanese | 18.2 /100 | #197 | Poor 82.5% |
| Immigrants | Denmark | 17.9 /100 | #198 | Poor 82.5% |
| Moroccans | 15.7 /100 | #199 | Poor 82.5% |
| French Canadians | 15.4 /100 | #200 | Poor 82.5% |
| Canadians | 15.1 /100 | #201 | Poor 82.4% |
Demographics Similar to Afghans by In Labor Force | Age 45-54
In terms of in labor force | age 45-54, the demographic groups most similar to Afghans are Immigrants from Kenya (83.5%, a difference of 0.0%), Immigrants from Taiwan (83.5%, a difference of 0.010%), Egyptian (83.5%, a difference of 0.010%), Asian (83.4%, a difference of 0.020%), and Chilean (83.4%, a difference of 0.020%).
| Demographics | Rating | Rank | In Labor Force | Age 45-54 |
| Immigrants | Peru | 98.6 /100 | #56 | Exceptional 83.5% |
| Paraguayans | 98.5 /100 | #57 | Exceptional 83.5% |
| Eastern Europeans | 98.5 /100 | #58 | Exceptional 83.5% |
| Bhutanese | 98.3 /100 | #59 | Exceptional 83.5% |
| Carpatho Rusyns | 98.3 /100 | #60 | Exceptional 83.5% |
| Filipinos | 98.3 /100 | #61 | Exceptional 83.5% |
| Immigrants | Taiwan | 98.0 /100 | #62 | Exceptional 83.5% |
| Afghans | 97.9 /100 | #63 | Exceptional 83.5% |
| Immigrants | Kenya | 97.9 /100 | #64 | Exceptional 83.5% |
| Egyptians | 97.9 /100 | #65 | Exceptional 83.5% |
| Asians | 97.7 /100 | #66 | Exceptional 83.4% |
| Chileans | 97.7 /100 | #67 | Exceptional 83.4% |
| Immigrants | Colombia | 97.6 /100 | #68 | Exceptional 83.4% |
| Taiwanese | 97.5 /100 | #69 | Exceptional 83.4% |
| Immigrants | Latvia | 97.4 /100 | #70 | Exceptional 83.4% |