Immigrants from Dominica vs Nigerian Ambulatory Disability
COMPARE
Immigrants from Dominica
Nigerian
Ambulatory Disability
Ambulatory Disability Comparison
Immigrants from Dominica
Nigerians
6.9%
AMBULATORY DISABILITY
0.0/ 100
METRIC RATING
289th/ 347
METRIC RANK
6.1%
AMBULATORY DISABILITY
67.1/ 100
METRIC RATING
162nd/ 347
METRIC RANK
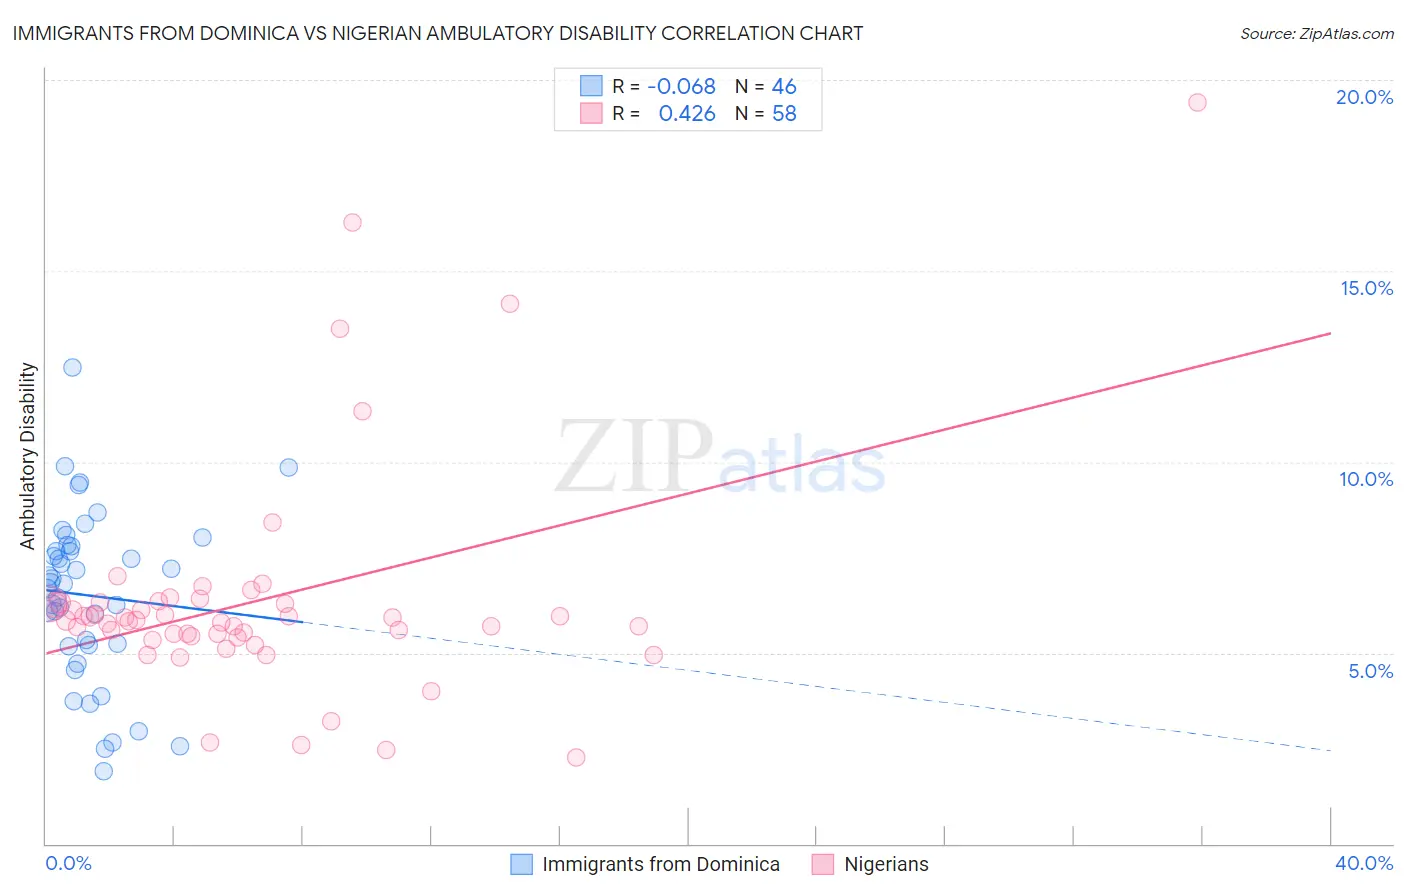
Immigrants from Dominica vs Nigerian Ambulatory Disability Correlation Chart
The statistical analysis conducted on geographies consisting of 83,791,064 people shows a slight negative correlation between the proportion of Immigrants from Dominica and percentage of population with ambulatory disability in the United States with a correlation coefficient (R) of -0.068 and weighted average of 6.9%. Similarly, the statistical analysis conducted on geographies consisting of 332,639,431 people shows a moderate positive correlation between the proportion of Nigerians and percentage of population with ambulatory disability in the United States with a correlation coefficient (R) of 0.426 and weighted average of 6.1%, a difference of 13.2%.
Ambulatory Disability Correlation Summary
| Measurement | Immigrants from Dominica | Nigerian |
| Minimum | 1.9% | 2.2% |
| Maximum | 12.5% | 19.4% |
| Range | 10.6% | 17.2% |
| Mean | 6.5% | 6.4% |
| Median | 6.8% | 5.9% |
| Interquartile 25% (IQ1) | 5.2% | 5.4% |
| Interquartile 75% (IQ3) | 7.8% | 6.3% |
| Interquartile Range (IQR) | 2.6% | 0.90% |
| Standard Deviation (Sample) | 2.2% | 3.0% |
| Standard Deviation (Population) | 2.2% | 3.0% |
Similar Demographics by Ambulatory Disability
Demographics Similar to Immigrants from Dominica by Ambulatory Disability
In terms of ambulatory disability, the demographic groups most similar to Immigrants from Dominica are Scotch-Irish (6.9%, a difference of 0.030%), West Indian (6.9%, a difference of 0.12%), Nonimmigrants (6.9%, a difference of 0.14%), Cheyenne (6.9%, a difference of 0.19%), and U.S. Virgin Islander (6.8%, a difference of 0.41%).
| Demographics | Rating | Rank | Ambulatory Disability |
| Barbadians | 0.0 /100 | #282 | Tragic 6.8% |
| Immigrants | Barbados | 0.0 /100 | #283 | Tragic 6.8% |
| Immigrants | Jamaica | 0.0 /100 | #284 | Tragic 6.8% |
| Fijians | 0.0 /100 | #285 | Tragic 6.8% |
| Yakama | 0.0 /100 | #286 | Tragic 6.8% |
| U.S. Virgin Islanders | 0.0 /100 | #287 | Tragic 6.8% |
| Immigrants | Nonimmigrants | 0.0 /100 | #288 | Tragic 6.9% |
| Immigrants | Dominica | 0.0 /100 | #289 | Tragic 6.9% |
| Scotch-Irish | 0.0 /100 | #290 | Tragic 6.9% |
| West Indians | 0.0 /100 | #291 | Tragic 6.9% |
| Cheyenne | 0.0 /100 | #292 | Tragic 6.9% |
| Immigrants | St. Vincent and the Grenadines | 0.0 /100 | #293 | Tragic 6.9% |
| Cape Verdeans | 0.0 /100 | #294 | Tragic 6.9% |
| Crow | 0.0 /100 | #295 | Tragic 6.9% |
| Alaskan Athabascans | 0.0 /100 | #296 | Tragic 6.9% |
Demographics Similar to Nigerians by Ambulatory Disability
In terms of ambulatory disability, the demographic groups most similar to Nigerians are Lebanese (6.1%, a difference of 0.050%), Immigrants from Belarus (6.1%, a difference of 0.13%), Central American (6.0%, a difference of 0.17%), Basque (6.1%, a difference of 0.20%), and Nicaraguan (6.1%, a difference of 0.23%).
| Demographics | Rating | Rank | Ambulatory Disability |
| Immigrants | Scotland | 72.1 /100 | #155 | Good 6.0% |
| Northern Europeans | 71.8 /100 | #156 | Good 6.0% |
| Ghanaians | 71.3 /100 | #157 | Good 6.0% |
| Immigrants | Fiji | 71.2 /100 | #158 | Good 6.0% |
| Immigrants | Latvia | 71.1 /100 | #159 | Good 6.0% |
| Central Americans | 69.8 /100 | #160 | Good 6.0% |
| Immigrants | Belarus | 69.2 /100 | #161 | Good 6.1% |
| Nigerians | 67.1 /100 | #162 | Good 6.1% |
| Lebanese | 66.2 /100 | #163 | Good 6.1% |
| Basques | 63.7 /100 | #164 | Good 6.1% |
| Nicaraguans | 63.2 /100 | #165 | Good 6.1% |
| Iraqis | 62.8 /100 | #166 | Good 6.1% |
| Immigrants | Oceania | 60.7 /100 | #167 | Good 6.1% |
| Ecuadorians | 60.5 /100 | #168 | Good 6.1% |
| Immigrants | Southern Europe | 58.1 /100 | #169 | Average 6.1% |