Asian vs Nigerian Ambulatory Disability
COMPARE
Asian
Nigerian
Ambulatory Disability
Ambulatory Disability Comparison
Asians
Nigerians
5.4%
AMBULATORY DISABILITY
100.0/ 100
METRIC RATING
27th/ 347
METRIC RANK
6.1%
AMBULATORY DISABILITY
67.1/ 100
METRIC RATING
162nd/ 347
METRIC RANK
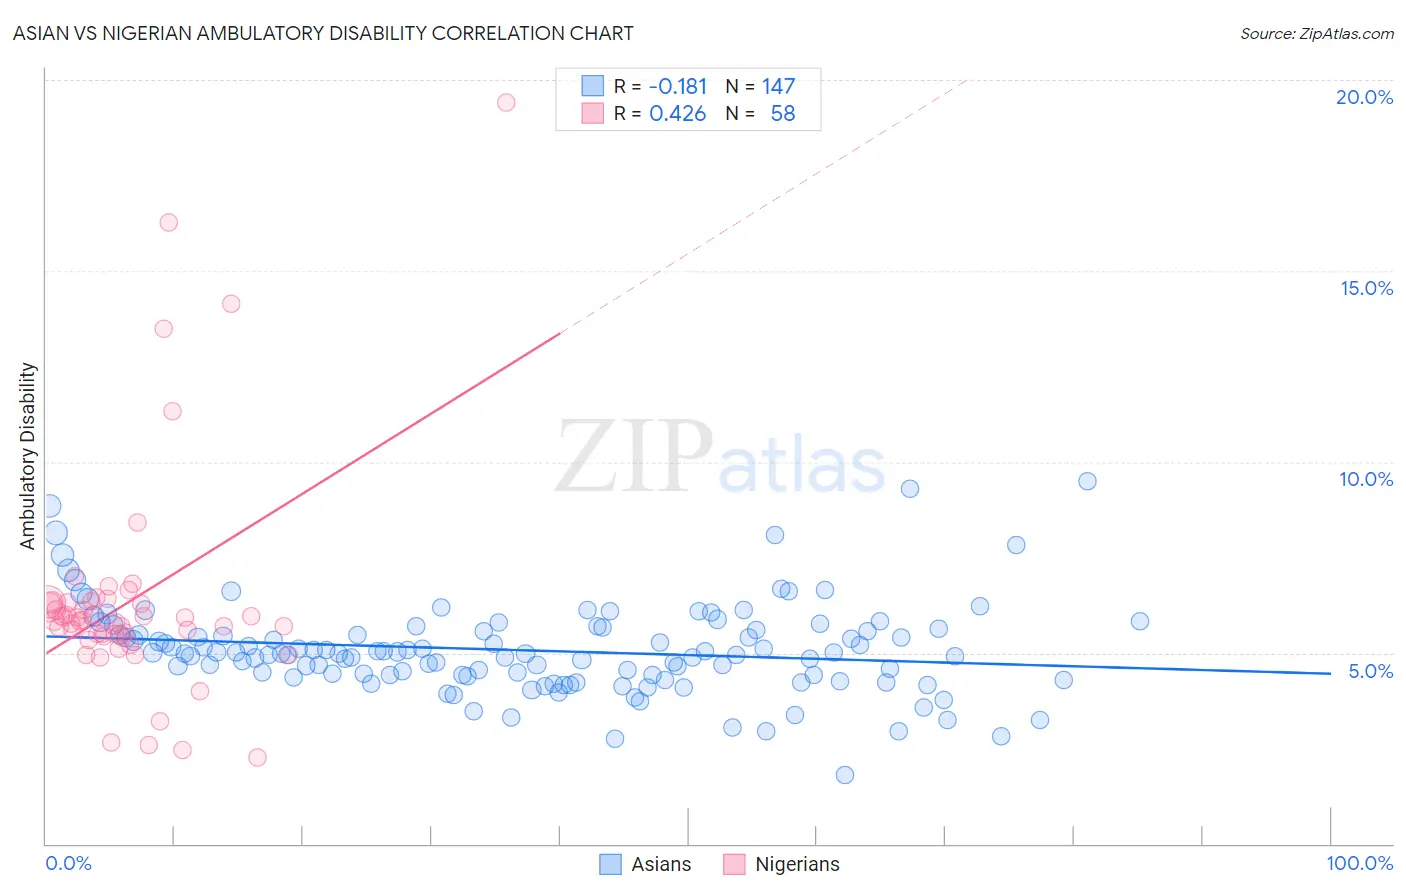
Asian vs Nigerian Ambulatory Disability Correlation Chart
The statistical analysis conducted on geographies consisting of 550,442,799 people shows a poor negative correlation between the proportion of Asians and percentage of population with ambulatory disability in the United States with a correlation coefficient (R) of -0.181 and weighted average of 5.4%. Similarly, the statistical analysis conducted on geographies consisting of 332,639,431 people shows a moderate positive correlation between the proportion of Nigerians and percentage of population with ambulatory disability in the United States with a correlation coefficient (R) of 0.426 and weighted average of 6.1%, a difference of 12.1%.
Ambulatory Disability Correlation Summary
| Measurement | Asian | Nigerian |
| Minimum | 1.8% | 2.2% |
| Maximum | 9.5% | 19.4% |
| Range | 7.7% | 17.2% |
| Mean | 5.1% | 6.4% |
| Median | 5.0% | 5.9% |
| Interquartile 25% (IQ1) | 4.4% | 5.4% |
| Interquartile 75% (IQ3) | 5.6% | 6.3% |
| Interquartile Range (IQR) | 1.2% | 0.90% |
| Standard Deviation (Sample) | 1.2% | 3.0% |
| Standard Deviation (Population) | 1.2% | 3.0% |
Similar Demographics by Ambulatory Disability
Demographics Similar to Asians by Ambulatory Disability
In terms of ambulatory disability, the demographic groups most similar to Asians are Cambodian (5.4%, a difference of 0.060%), Immigrants from Nepal (5.4%, a difference of 0.16%), Immigrants from Iran (5.4%, a difference of 0.16%), Zimbabwean (5.4%, a difference of 0.19%), and Immigrants from Saudi Arabia (5.4%, a difference of 0.27%).
| Demographics | Rating | Rank | Ambulatory Disability |
| Ethiopians | 100.0 /100 | #20 | Exceptional 5.4% |
| Immigrants | Kuwait | 100.0 /100 | #21 | Exceptional 5.4% |
| Immigrants | Israel | 100.0 /100 | #22 | Exceptional 5.4% |
| Tongans | 100.0 /100 | #23 | Exceptional 5.4% |
| Immigrants | Saudi Arabia | 100.0 /100 | #24 | Exceptional 5.4% |
| Zimbabweans | 100.0 /100 | #25 | Exceptional 5.4% |
| Immigrants | Nepal | 100.0 /100 | #26 | Exceptional 5.4% |
| Asians | 100.0 /100 | #27 | Exceptional 5.4% |
| Cambodians | 100.0 /100 | #28 | Exceptional 5.4% |
| Immigrants | Iran | 100.0 /100 | #29 | Exceptional 5.4% |
| Immigrants | Turkey | 100.0 /100 | #30 | Exceptional 5.4% |
| Immigrants | Venezuela | 100.0 /100 | #31 | Exceptional 5.4% |
| Immigrants | Australia | 100.0 /100 | #32 | Exceptional 5.5% |
| Immigrants | Pakistan | 100.0 /100 | #33 | Exceptional 5.5% |
| Immigrants | Asia | 100.0 /100 | #34 | Exceptional 5.5% |
Demographics Similar to Nigerians by Ambulatory Disability
In terms of ambulatory disability, the demographic groups most similar to Nigerians are Lebanese (6.1%, a difference of 0.050%), Immigrants from Belarus (6.1%, a difference of 0.13%), Central American (6.0%, a difference of 0.17%), Basque (6.1%, a difference of 0.20%), and Nicaraguan (6.1%, a difference of 0.23%).
| Demographics | Rating | Rank | Ambulatory Disability |
| Immigrants | Scotland | 72.1 /100 | #155 | Good 6.0% |
| Northern Europeans | 71.8 /100 | #156 | Good 6.0% |
| Ghanaians | 71.3 /100 | #157 | Good 6.0% |
| Immigrants | Fiji | 71.2 /100 | #158 | Good 6.0% |
| Immigrants | Latvia | 71.1 /100 | #159 | Good 6.0% |
| Central Americans | 69.8 /100 | #160 | Good 6.0% |
| Immigrants | Belarus | 69.2 /100 | #161 | Good 6.1% |
| Nigerians | 67.1 /100 | #162 | Good 6.1% |
| Lebanese | 66.2 /100 | #163 | Good 6.1% |
| Basques | 63.7 /100 | #164 | Good 6.1% |
| Nicaraguans | 63.2 /100 | #165 | Good 6.1% |
| Iraqis | 62.8 /100 | #166 | Good 6.1% |
| Immigrants | Oceania | 60.7 /100 | #167 | Good 6.1% |
| Ecuadorians | 60.5 /100 | #168 | Good 6.1% |
| Immigrants | Southern Europe | 58.1 /100 | #169 | Average 6.1% |