Immigrants from North Macedonia vs Immigrants from Zaire Disability Age 5 to 17
COMPARE
Immigrants from North Macedonia
Immigrants from Zaire
Disability Age 5 to 17
Disability Age 5 to 17 Comparison
Immigrants from North Macedonia
Immigrants from Zaire
5.1%
DISABILITY AGE 5 TO 17
99.9/ 100
METRIC RATING
59th/ 347
METRIC RANK
6.0%
DISABILITY AGE 5 TO 17
0.2/ 100
METRIC RATING
271st/ 347
METRIC RANK
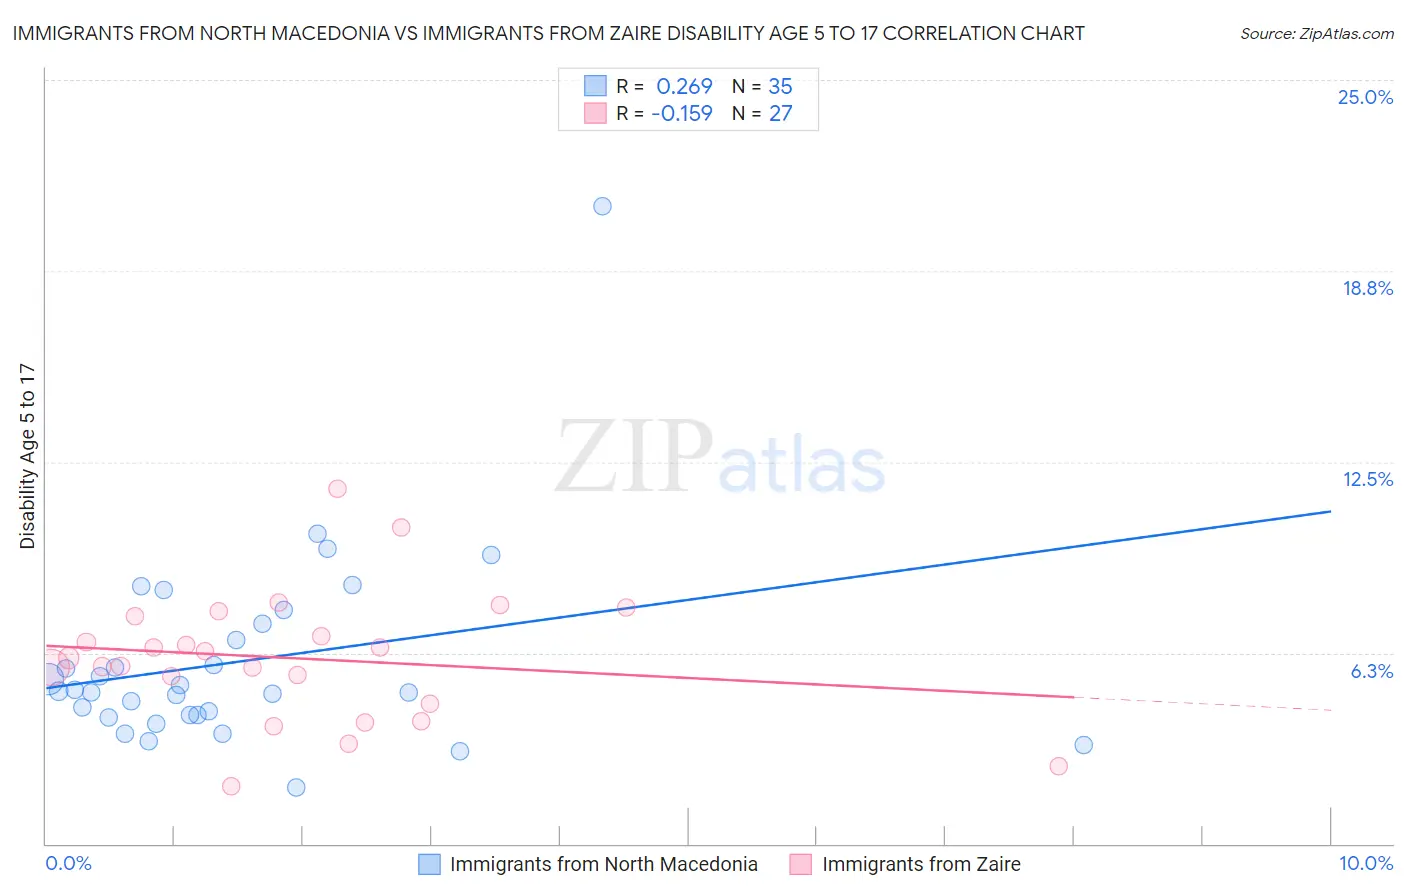
Immigrants from North Macedonia vs Immigrants from Zaire Disability Age 5 to 17 Correlation Chart
The statistical analysis conducted on geographies consisting of 74,064,473 people shows a weak positive correlation between the proportion of Immigrants from North Macedonia and percentage of population with a disability between the ages 5 and 17 in the United States with a correlation coefficient (R) of 0.269 and weighted average of 5.1%. Similarly, the statistical analysis conducted on geographies consisting of 107,054,393 people shows a poor negative correlation between the proportion of Immigrants from Zaire and percentage of population with a disability between the ages 5 and 17 in the United States with a correlation coefficient (R) of -0.159 and weighted average of 6.0%, a difference of 17.4%.
Disability Age 5 to 17 Correlation Summary
| Measurement | Immigrants from North Macedonia | Immigrants from Zaire |
| Minimum | 1.9% | 1.9% |
| Maximum | 20.9% | 11.6% |
| Range | 19.0% | 9.7% |
| Mean | 6.0% | 6.1% |
| Median | 5.0% | 6.1% |
| Interquartile 25% (IQ1) | 4.2% | 4.6% |
| Interquartile 75% (IQ3) | 7.2% | 7.4% |
| Interquartile Range (IQR) | 3.0% | 2.8% |
| Standard Deviation (Sample) | 3.3% | 2.1% |
| Standard Deviation (Population) | 3.2% | 2.1% |
Similar Demographics by Disability Age 5 to 17
Demographics Similar to Immigrants from North Macedonia by Disability Age 5 to 17
In terms of disability age 5 to 17, the demographic groups most similar to Immigrants from North Macedonia are Immigrants from Eastern Europe (5.1%, a difference of 0.11%), Immigrants from Ukraine (5.1%, a difference of 0.18%), Immigrants from Poland (5.1%, a difference of 0.26%), Immigrants from Turkey (5.1%, a difference of 0.41%), and Laotian (5.1%, a difference of 0.42%).
| Demographics | Rating | Rank | Disability Age 5 to 17 |
| Immigrants | Fiji | 99.9 /100 | #52 | Exceptional 5.1% |
| Immigrants | Lithuania | 99.9 /100 | #53 | Exceptional 5.1% |
| Paraguayans | 99.9 /100 | #54 | Exceptional 5.1% |
| Laotians | 99.9 /100 | #55 | Exceptional 5.1% |
| Immigrants | Turkey | 99.9 /100 | #56 | Exceptional 5.1% |
| Immigrants | Poland | 99.9 /100 | #57 | Exceptional 5.1% |
| Immigrants | Ukraine | 99.9 /100 | #58 | Exceptional 5.1% |
| Immigrants | North Macedonia | 99.9 /100 | #59 | Exceptional 5.1% |
| Immigrants | Eastern Europe | 99.9 /100 | #60 | Exceptional 5.1% |
| Immigrants | Switzerland | 99.8 /100 | #61 | Exceptional 5.2% |
| Immigrants | Ireland | 99.8 /100 | #62 | Exceptional 5.2% |
| Immigrants | Bangladesh | 99.8 /100 | #63 | Exceptional 5.2% |
| Immigrants | South Eastern Asia | 99.8 /100 | #64 | Exceptional 5.2% |
| Immigrants | Greece | 99.8 /100 | #65 | Exceptional 5.2% |
| Palestinians | 99.8 /100 | #66 | Exceptional 5.2% |
Demographics Similar to Immigrants from Zaire by Disability Age 5 to 17
In terms of disability age 5 to 17, the demographic groups most similar to Immigrants from Zaire are Finnish (6.0%, a difference of 0.030%), Alaska Native (6.0%, a difference of 0.080%), Cheyenne (6.0%, a difference of 0.19%), Dutch (6.0%, a difference of 0.30%), and Japanese (6.1%, a difference of 0.40%).
| Demographics | Rating | Rank | Disability Age 5 to 17 |
| Canadians | 0.6 /100 | #264 | Tragic 6.0% |
| Panamanians | 0.6 /100 | #265 | Tragic 6.0% |
| Slovenes | 0.6 /100 | #266 | Tragic 6.0% |
| Spanish | 0.5 /100 | #267 | Tragic 6.0% |
| Sioux | 0.4 /100 | #268 | Tragic 6.0% |
| Liberians | 0.4 /100 | #269 | Tragic 6.0% |
| Immigrants | Somalia | 0.4 /100 | #270 | Tragic 6.0% |
| Immigrants | Zaire | 0.2 /100 | #271 | Tragic 6.0% |
| Finns | 0.2 /100 | #272 | Tragic 6.0% |
| Alaska Natives | 0.2 /100 | #273 | Tragic 6.0% |
| Cheyenne | 0.2 /100 | #274 | Tragic 6.0% |
| Dutch | 0.2 /100 | #275 | Tragic 6.0% |
| Japanese | 0.1 /100 | #276 | Tragic 6.1% |
| Puget Sound Salish | 0.1 /100 | #277 | Tragic 6.1% |
| Immigrants | Liberia | 0.1 /100 | #278 | Tragic 6.1% |