Immigrants from North Macedonia vs Immigrants from Belize Disability Age 5 to 17
COMPARE
Immigrants from North Macedonia
Immigrants from Belize
Disability Age 5 to 17
Disability Age 5 to 17 Comparison
Immigrants from North Macedonia
Immigrants from Belize
5.1%
DISABILITY AGE 5 TO 17
99.9/ 100
METRIC RATING
59th/ 347
METRIC RANK
5.4%
DISABILITY AGE 5 TO 17
91.7/ 100
METRIC RATING
135th/ 347
METRIC RANK
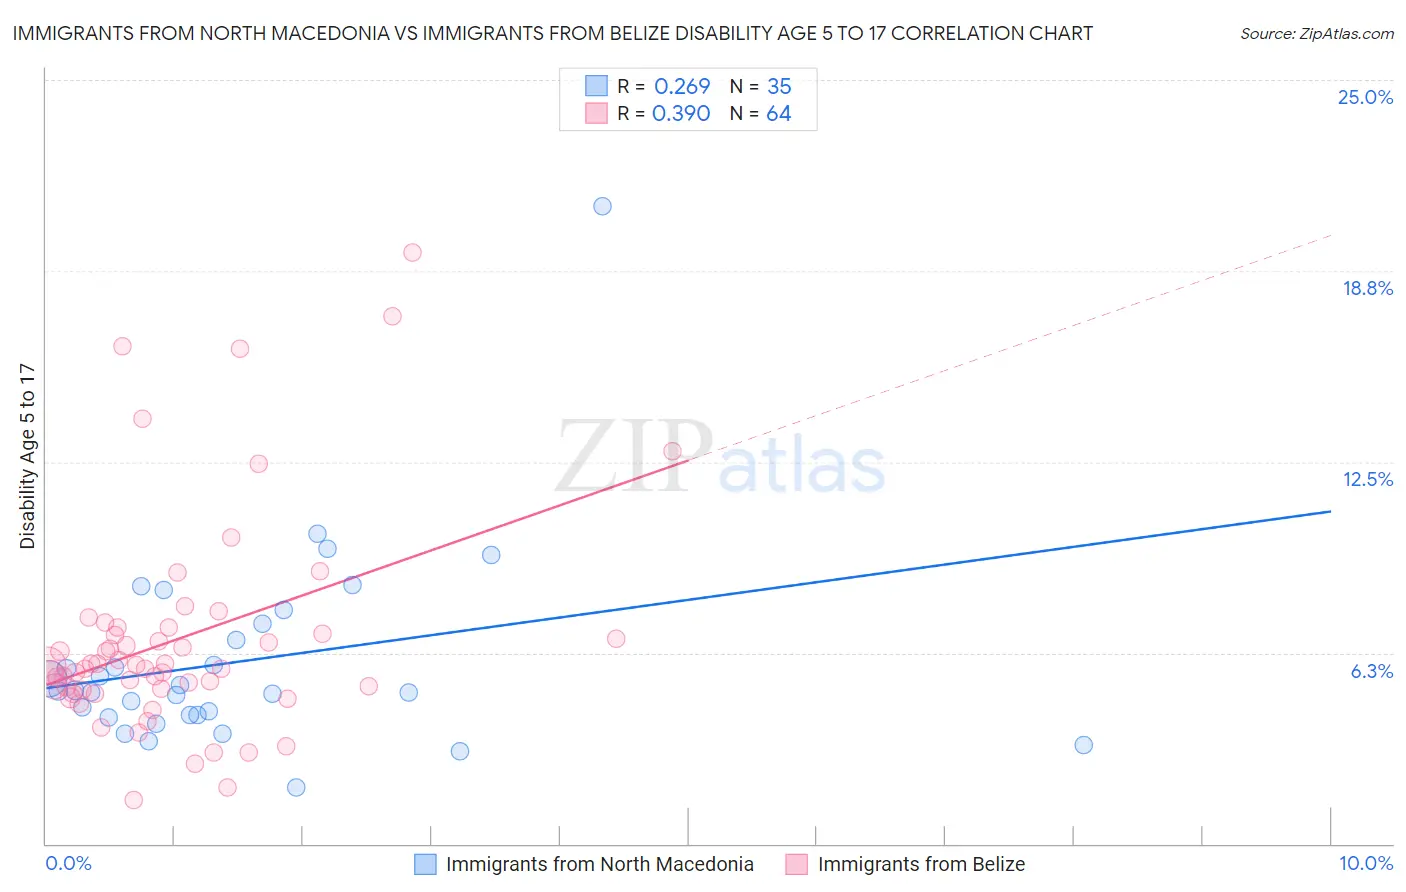
Immigrants from North Macedonia vs Immigrants from Belize Disability Age 5 to 17 Correlation Chart
The statistical analysis conducted on geographies consisting of 74,064,473 people shows a weak positive correlation between the proportion of Immigrants from North Macedonia and percentage of population with a disability between the ages 5 and 17 in the United States with a correlation coefficient (R) of 0.269 and weighted average of 5.1%. Similarly, the statistical analysis conducted on geographies consisting of 129,905,641 people shows a mild positive correlation between the proportion of Immigrants from Belize and percentage of population with a disability between the ages 5 and 17 in the United States with a correlation coefficient (R) of 0.390 and weighted average of 5.4%, a difference of 5.8%.
Disability Age 5 to 17 Correlation Summary
| Measurement | Immigrants from North Macedonia | Immigrants from Belize |
| Minimum | 1.9% | 1.4% |
| Maximum | 20.9% | 19.4% |
| Range | 19.0% | 17.9% |
| Mean | 6.0% | 6.7% |
| Median | 5.0% | 5.8% |
| Interquartile 25% (IQ1) | 4.2% | 5.1% |
| Interquartile 75% (IQ3) | 7.2% | 7.0% |
| Interquartile Range (IQR) | 3.0% | 1.9% |
| Standard Deviation (Sample) | 3.3% | 3.5% |
| Standard Deviation (Population) | 3.2% | 3.5% |
Similar Demographics by Disability Age 5 to 17
Demographics Similar to Immigrants from North Macedonia by Disability Age 5 to 17
In terms of disability age 5 to 17, the demographic groups most similar to Immigrants from North Macedonia are Immigrants from Eastern Europe (5.1%, a difference of 0.11%), Immigrants from Ukraine (5.1%, a difference of 0.18%), Immigrants from Poland (5.1%, a difference of 0.26%), Immigrants from Turkey (5.1%, a difference of 0.41%), and Laotian (5.1%, a difference of 0.42%).
| Demographics | Rating | Rank | Disability Age 5 to 17 |
| Immigrants | Fiji | 99.9 /100 | #52 | Exceptional 5.1% |
| Immigrants | Lithuania | 99.9 /100 | #53 | Exceptional 5.1% |
| Paraguayans | 99.9 /100 | #54 | Exceptional 5.1% |
| Laotians | 99.9 /100 | #55 | Exceptional 5.1% |
| Immigrants | Turkey | 99.9 /100 | #56 | Exceptional 5.1% |
| Immigrants | Poland | 99.9 /100 | #57 | Exceptional 5.1% |
| Immigrants | Ukraine | 99.9 /100 | #58 | Exceptional 5.1% |
| Immigrants | North Macedonia | 99.9 /100 | #59 | Exceptional 5.1% |
| Immigrants | Eastern Europe | 99.9 /100 | #60 | Exceptional 5.1% |
| Immigrants | Switzerland | 99.8 /100 | #61 | Exceptional 5.2% |
| Immigrants | Ireland | 99.8 /100 | #62 | Exceptional 5.2% |
| Immigrants | Bangladesh | 99.8 /100 | #63 | Exceptional 5.2% |
| Immigrants | South Eastern Asia | 99.8 /100 | #64 | Exceptional 5.2% |
| Immigrants | Greece | 99.8 /100 | #65 | Exceptional 5.2% |
| Palestinians | 99.8 /100 | #66 | Exceptional 5.2% |
Demographics Similar to Immigrants from Belize by Disability Age 5 to 17
In terms of disability age 5 to 17, the demographic groups most similar to Immigrants from Belize are Immigrants from Denmark (5.4%, a difference of 0.050%), Yuman (5.4%, a difference of 0.10%), Navajo (5.4%, a difference of 0.13%), Immigrants from Oceania (5.4%, a difference of 0.14%), and Belizean (5.4%, a difference of 0.14%).
| Demographics | Rating | Rank | Disability Age 5 to 17 |
| Immigrants | Venezuela | 94.5 /100 | #128 | Exceptional 5.4% |
| Romanians | 94.1 /100 | #129 | Exceptional 5.4% |
| Immigrants | Bulgaria | 94.0 /100 | #130 | Exceptional 5.4% |
| Arabs | 92.9 /100 | #131 | Exceptional 5.4% |
| Immigrants | Colombia | 92.9 /100 | #132 | Exceptional 5.4% |
| Venezuelans | 92.7 /100 | #133 | Exceptional 5.4% |
| Yuman | 92.3 /100 | #134 | Exceptional 5.4% |
| Immigrants | Belize | 91.7 /100 | #135 | Exceptional 5.4% |
| Immigrants | Denmark | 91.4 /100 | #136 | Exceptional 5.4% |
| Navajo | 90.9 /100 | #137 | Exceptional 5.4% |
| Immigrants | Oceania | 90.8 /100 | #138 | Exceptional 5.4% |
| Belizeans | 90.8 /100 | #139 | Exceptional 5.4% |
| Immigrants | Netherlands | 90.5 /100 | #140 | Exceptional 5.4% |
| South American Indians | 89.3 /100 | #141 | Excellent 5.5% |
| Colombians | 88.0 /100 | #142 | Excellent 5.5% |