Immigrants from North Macedonia vs Immigrants from Zaire 10th Grade
COMPARE
Immigrants from North Macedonia
Immigrants from Zaire
10th Grade
10th Grade Comparison
Immigrants from North Macedonia
Immigrants from Zaire
94.5%
10TH GRADE
97.2/ 100
METRIC RATING
108th/ 347
METRIC RANK
93.4%
10TH GRADE
16.7/ 100
METRIC RATING
212th/ 347
METRIC RANK
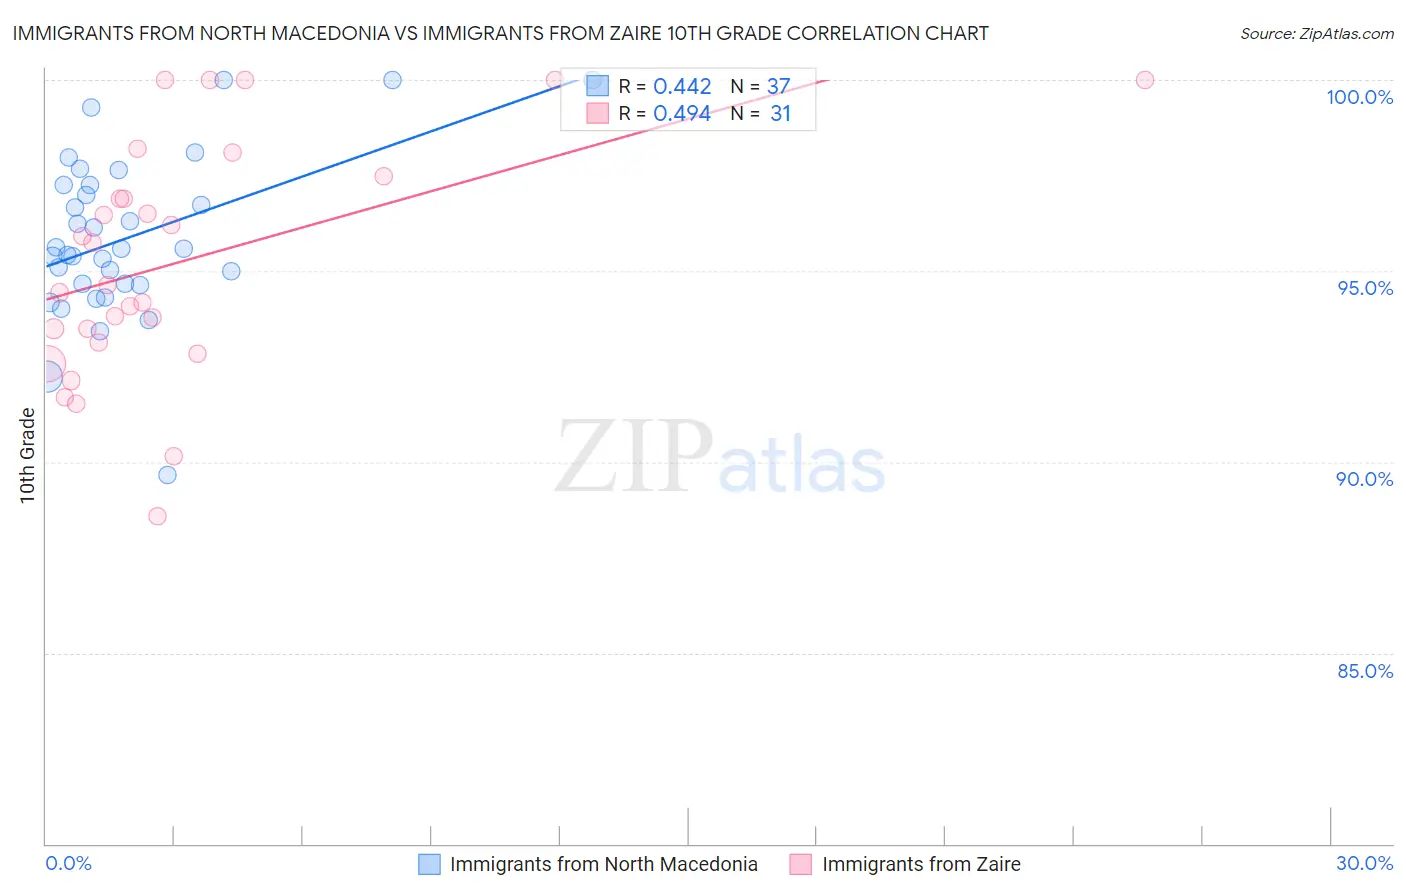
Immigrants from North Macedonia vs Immigrants from Zaire 10th Grade Correlation Chart
The statistical analysis conducted on geographies consisting of 74,300,344 people shows a moderate positive correlation between the proportion of Immigrants from North Macedonia and percentage of population with at least 10th grade education in the United States with a correlation coefficient (R) of 0.442 and weighted average of 94.5%. Similarly, the statistical analysis conducted on geographies consisting of 107,212,695 people shows a moderate positive correlation between the proportion of Immigrants from Zaire and percentage of population with at least 10th grade education in the United States with a correlation coefficient (R) of 0.494 and weighted average of 93.4%, a difference of 1.2%.
10th Grade Correlation Summary
| Measurement | Immigrants from North Macedonia | Immigrants from Zaire |
| Minimum | 89.6% | 88.6% |
| Maximum | 100.0% | 100.0% |
| Range | 10.4% | 11.4% |
| Mean | 95.9% | 95.3% |
| Median | 95.6% | 94.6% |
| Interquartile 25% (IQ1) | 94.6% | 93.1% |
| Interquartile 75% (IQ3) | 97.3% | 97.5% |
| Interquartile Range (IQR) | 2.6% | 4.4% |
| Standard Deviation (Sample) | 2.2% | 3.1% |
| Standard Deviation (Population) | 2.1% | 3.0% |
Similar Demographics by 10th Grade
Demographics Similar to Immigrants from North Macedonia by 10th Grade
In terms of 10th grade, the demographic groups most similar to Immigrants from North Macedonia are Immigrants from Norway (94.5%, a difference of 0.0%), Immigrants from Serbia (94.5%, a difference of 0.010%), Immigrants from Croatia (94.5%, a difference of 0.010%), Burmese (94.5%, a difference of 0.010%), and Immigrants from Europe (94.5%, a difference of 0.020%).
| Demographics | Rating | Rank | 10th Grade |
| Syrians | 97.7 /100 | #101 | Exceptional 94.5% |
| Cambodians | 97.6 /100 | #102 | Exceptional 94.5% |
| Immigrants | Europe | 97.5 /100 | #103 | Exceptional 94.5% |
| Immigrants | Romania | 97.5 /100 | #104 | Exceptional 94.5% |
| Immigrants | Turkey | 97.4 /100 | #105 | Exceptional 94.5% |
| Immigrants | Serbia | 97.4 /100 | #106 | Exceptional 94.5% |
| Immigrants | Croatia | 97.4 /100 | #107 | Exceptional 94.5% |
| Immigrants | North Macedonia | 97.2 /100 | #108 | Exceptional 94.5% |
| Immigrants | Norway | 97.2 /100 | #109 | Exceptional 94.5% |
| Burmese | 97.1 /100 | #110 | Exceptional 94.5% |
| Immigrants | Zimbabwe | 96.8 /100 | #111 | Exceptional 94.4% |
| Immigrants | Kuwait | 96.8 /100 | #112 | Exceptional 94.4% |
| Palestinians | 96.5 /100 | #113 | Exceptional 94.4% |
| German Russians | 96.3 /100 | #114 | Exceptional 94.4% |
| Delaware | 96.3 /100 | #115 | Exceptional 94.4% |
Demographics Similar to Immigrants from Zaire by 10th Grade
In terms of 10th grade, the demographic groups most similar to Immigrants from Zaire are Cajun (93.4%, a difference of 0.0%), Indian (Asian) (93.4%, a difference of 0.010%), Immigrants from Asia (93.4%, a difference of 0.020%), Immigrants from Bahamas (93.4%, a difference of 0.020%), and Immigrants from Chile (93.4%, a difference of 0.030%).
| Demographics | Rating | Rank | 10th Grade |
| Immigrants | Indonesia | 20.2 /100 | #205 | Fair 93.4% |
| Immigrants | Sudan | 20.0 /100 | #206 | Fair 93.4% |
| Samoans | 19.5 /100 | #207 | Poor 93.4% |
| Immigrants | Syria | 19.4 /100 | #208 | Poor 93.4% |
| Immigrants | Chile | 18.8 /100 | #209 | Poor 93.4% |
| Indians (Asian) | 17.6 /100 | #210 | Poor 93.4% |
| Cajuns | 16.9 /100 | #211 | Poor 93.4% |
| Immigrants | Zaire | 16.7 /100 | #212 | Poor 93.4% |
| Immigrants | Asia | 15.7 /100 | #213 | Poor 93.4% |
| Immigrants | Bahamas | 15.2 /100 | #214 | Poor 93.4% |
| Immigrants | Oceania | 15.1 /100 | #215 | Poor 93.4% |
| Immigrants | Eastern Africa | 14.7 /100 | #216 | Poor 93.4% |
| Portuguese | 12.1 /100 | #217 | Poor 93.3% |
| Immigrants | Liberia | 10.2 /100 | #218 | Poor 93.3% |
| Seminole | 10.2 /100 | #219 | Poor 93.3% |