Ethiopian vs Immigrants from the Azores Ambulatory Disability
COMPARE
Ethiopian
Immigrants from the Azores
Ambulatory Disability
Ambulatory Disability Comparison
Ethiopians
Immigrants from the Azores
5.4%
AMBULATORY DISABILITY
100.0/ 100
METRIC RATING
20th/ 347
METRIC RANK
7.1%
AMBULATORY DISABILITY
0.0/ 100
METRIC RATING
309th/ 347
METRIC RANK
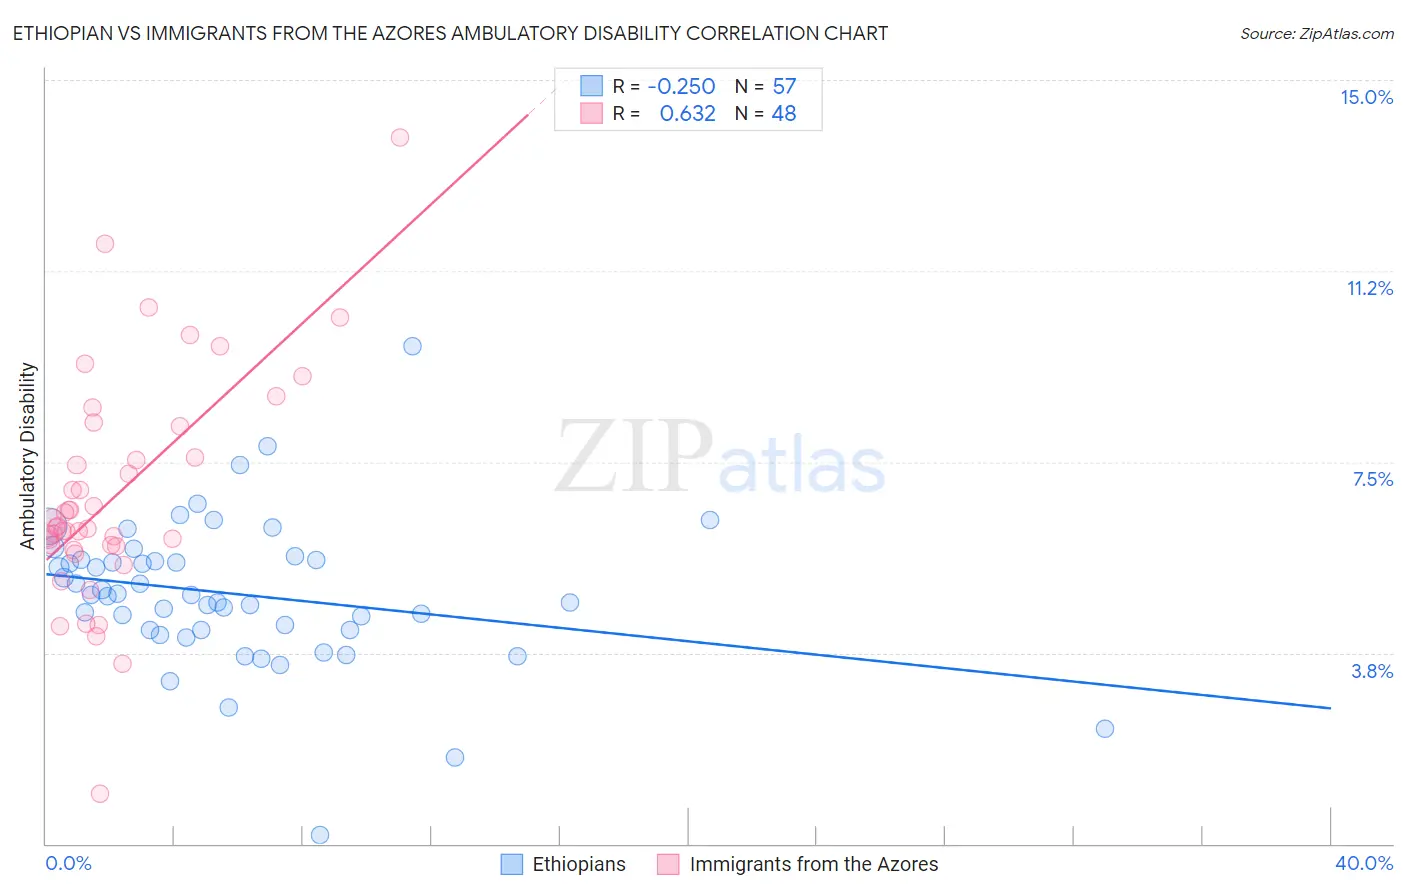
Ethiopian vs Immigrants from the Azores Ambulatory Disability Correlation Chart
The statistical analysis conducted on geographies consisting of 223,167,947 people shows a weak negative correlation between the proportion of Ethiopians and percentage of population with ambulatory disability in the United States with a correlation coefficient (R) of -0.250 and weighted average of 5.4%. Similarly, the statistical analysis conducted on geographies consisting of 46,257,178 people shows a significant positive correlation between the proportion of Immigrants from the Azores and percentage of population with ambulatory disability in the United States with a correlation coefficient (R) of 0.632 and weighted average of 7.1%, a difference of 32.1%.
Ambulatory Disability Correlation Summary
| Measurement | Ethiopian | Immigrants from the Azores |
| Minimum | 0.17% | 0.99% |
| Maximum | 9.8% | 13.9% |
| Range | 9.6% | 12.9% |
| Mean | 4.9% | 6.8% |
| Median | 4.9% | 6.2% |
| Interquartile 25% (IQ1) | 4.2% | 5.9% |
| Interquartile 75% (IQ3) | 5.6% | 7.9% |
| Interquartile Range (IQR) | 1.4% | 2.0% |
| Standard Deviation (Sample) | 1.5% | 2.2% |
| Standard Deviation (Population) | 1.5% | 2.2% |
Similar Demographics by Ambulatory Disability
Demographics Similar to Ethiopians by Ambulatory Disability
In terms of ambulatory disability, the demographic groups most similar to Ethiopians are Immigrants from Kuwait (5.4%, a difference of 0.0%), Indian (Asian) (5.4%, a difference of 0.020%), Immigrants from Sri Lanka (5.4%, a difference of 0.12%), Immigrants from Ethiopia (5.4%, a difference of 0.13%), and Immigrants from Israel (5.4%, a difference of 0.37%).
| Demographics | Rating | Rank | Ambulatory Disability |
| Burmese | 100.0 /100 | #13 | Exceptional 5.3% |
| Immigrants | Eastern Asia | 100.0 /100 | #14 | Exceptional 5.3% |
| Immigrants | China | 100.0 /100 | #15 | Exceptional 5.3% |
| Immigrants | Hong Kong | 100.0 /100 | #16 | Exceptional 5.3% |
| Immigrants | Ethiopia | 100.0 /100 | #17 | Exceptional 5.4% |
| Immigrants | Sri Lanka | 100.0 /100 | #18 | Exceptional 5.4% |
| Indians (Asian) | 100.0 /100 | #19 | Exceptional 5.4% |
| Ethiopians | 100.0 /100 | #20 | Exceptional 5.4% |
| Immigrants | Kuwait | 100.0 /100 | #21 | Exceptional 5.4% |
| Immigrants | Israel | 100.0 /100 | #22 | Exceptional 5.4% |
| Tongans | 100.0 /100 | #23 | Exceptional 5.4% |
| Immigrants | Saudi Arabia | 100.0 /100 | #24 | Exceptional 5.4% |
| Zimbabweans | 100.0 /100 | #25 | Exceptional 5.4% |
| Immigrants | Nepal | 100.0 /100 | #26 | Exceptional 5.4% |
| Asians | 100.0 /100 | #27 | Exceptional 5.4% |
Demographics Similar to Immigrants from the Azores by Ambulatory Disability
In terms of ambulatory disability, the demographic groups most similar to Immigrants from the Azores are Spanish American (7.1%, a difference of 0.17%), Chippewa (7.1%, a difference of 0.17%), Arapaho (7.1%, a difference of 0.28%), Cree (7.1%, a difference of 0.29%), and Iroquois (7.1%, a difference of 0.44%).
| Demographics | Rating | Rank | Ambulatory Disability |
| Immigrants | Armenia | 0.0 /100 | #302 | Tragic 7.0% |
| Africans | 0.0 /100 | #303 | Tragic 7.0% |
| Immigrants | Cabo Verde | 0.0 /100 | #304 | Tragic 7.0% |
| Immigrants | Micronesia | 0.0 /100 | #305 | Tragic 7.0% |
| Iroquois | 0.0 /100 | #306 | Tragic 7.1% |
| Spanish Americans | 0.0 /100 | #307 | Tragic 7.1% |
| Chippewa | 0.0 /100 | #308 | Tragic 7.1% |
| Immigrants | Azores | 0.0 /100 | #309 | Tragic 7.1% |
| Arapaho | 0.0 /100 | #310 | Tragic 7.1% |
| Cree | 0.0 /100 | #311 | Tragic 7.1% |
| Delaware | 0.0 /100 | #312 | Tragic 7.1% |
| Immigrants | Yemen | 0.0 /100 | #313 | Tragic 7.1% |
| Blackfeet | 0.0 /100 | #314 | Tragic 7.1% |
| Shoshone | 0.0 /100 | #315 | Tragic 7.1% |
| Immigrants | Dominican Republic | 0.0 /100 | #316 | Tragic 7.1% |