Croatian vs Immigrants from the Azores Ambulatory Disability
COMPARE
Croatian
Immigrants from the Azores
Ambulatory Disability
Ambulatory Disability Comparison
Croatians
Immigrants from the Azores
6.1%
AMBULATORY DISABILITY
51.2/ 100
METRIC RATING
173rd/ 347
METRIC RANK
7.1%
AMBULATORY DISABILITY
0.0/ 100
METRIC RATING
309th/ 347
METRIC RANK
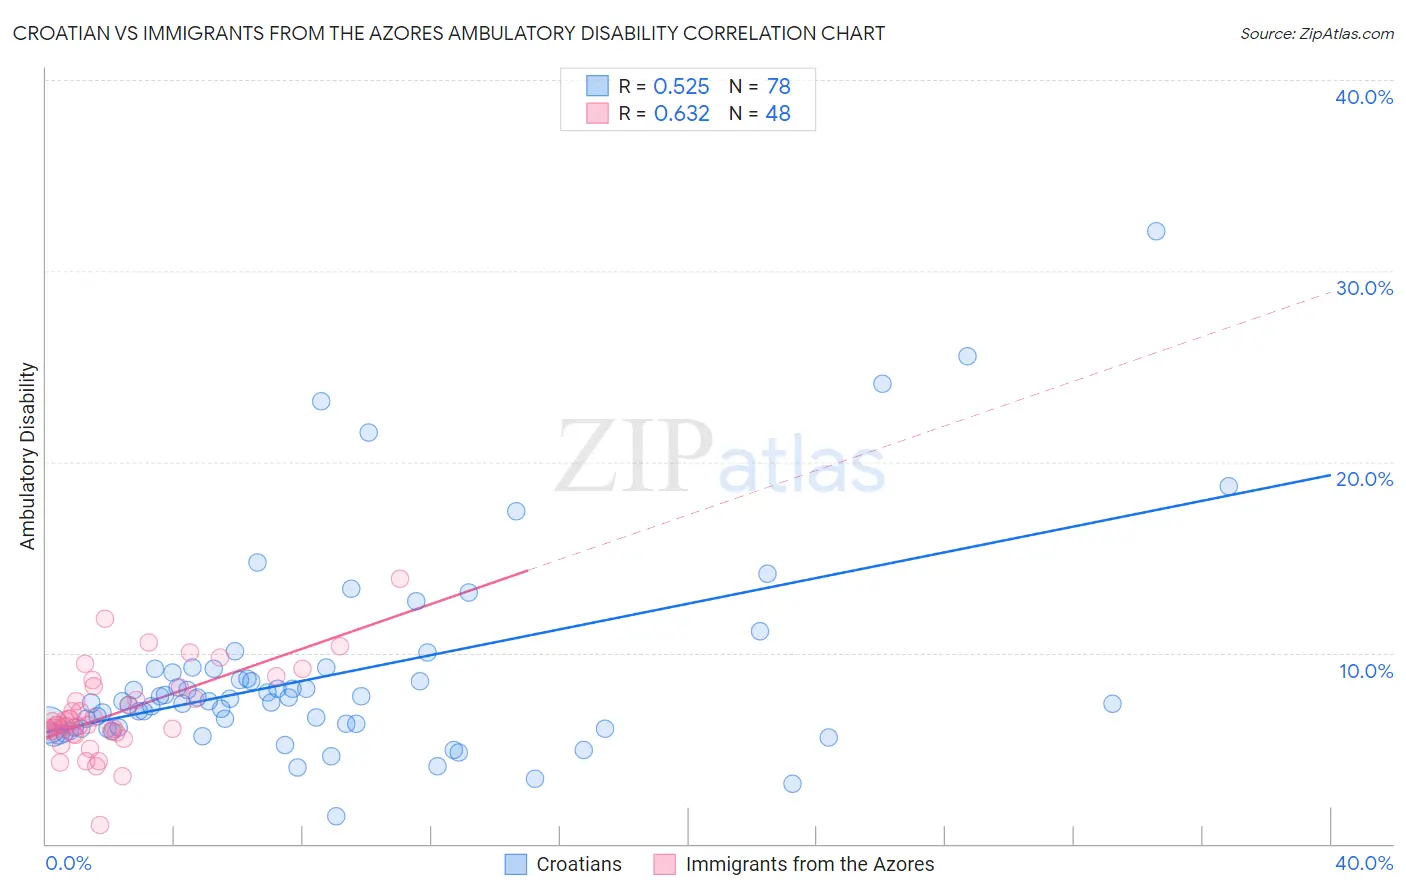
Croatian vs Immigrants from the Azores Ambulatory Disability Correlation Chart
The statistical analysis conducted on geographies consisting of 375,651,055 people shows a substantial positive correlation between the proportion of Croatians and percentage of population with ambulatory disability in the United States with a correlation coefficient (R) of 0.525 and weighted average of 6.1%. Similarly, the statistical analysis conducted on geographies consisting of 46,257,178 people shows a significant positive correlation between the proportion of Immigrants from the Azores and percentage of population with ambulatory disability in the United States with a correlation coefficient (R) of 0.632 and weighted average of 7.1%, a difference of 15.9%.
Ambulatory Disability Correlation Summary
| Measurement | Croatian | Immigrants from the Azores |
| Minimum | 1.5% | 0.99% |
| Maximum | 32.1% | 13.9% |
| Range | 30.6% | 12.9% |
| Mean | 8.8% | 6.8% |
| Median | 7.4% | 6.2% |
| Interquartile 25% (IQ1) | 6.1% | 5.9% |
| Interquartile 75% (IQ3) | 8.9% | 7.9% |
| Interquartile Range (IQR) | 2.9% | 2.0% |
| Standard Deviation (Sample) | 5.3% | 2.2% |
| Standard Deviation (Population) | 5.2% | 2.2% |
Similar Demographics by Ambulatory Disability
Demographics Similar to Croatians by Ambulatory Disability
In terms of ambulatory disability, the demographic groups most similar to Croatians are Immigrants from Burma/Myanmar (6.1%, a difference of 0.050%), Immigrants from Canada (6.1%, a difference of 0.060%), Moroccan (6.1%, a difference of 0.080%), Immigrants from Ecuador (6.1%, a difference of 0.14%), and Vietnamese (6.1%, a difference of 0.21%).
| Demographics | Rating | Rank | Ambulatory Disability |
| Iraqis | 62.8 /100 | #166 | Good 6.1% |
| Immigrants | Oceania | 60.7 /100 | #167 | Good 6.1% |
| Ecuadorians | 60.5 /100 | #168 | Good 6.1% |
| Immigrants | Southern Europe | 58.1 /100 | #169 | Average 6.1% |
| Immigrants | Ecuador | 53.8 /100 | #170 | Average 6.1% |
| Moroccans | 52.6 /100 | #171 | Average 6.1% |
| Immigrants | Burma/Myanmar | 52.2 /100 | #172 | Average 6.1% |
| Croatians | 51.2 /100 | #173 | Average 6.1% |
| Immigrants | Canada | 50.0 /100 | #174 | Average 6.1% |
| Vietnamese | 47.2 /100 | #175 | Average 6.1% |
| Immigrants | North America | 45.6 /100 | #176 | Average 6.1% |
| Immigrants | England | 45.4 /100 | #177 | Average 6.1% |
| Scandinavians | 44.5 /100 | #178 | Average 6.1% |
| Austrians | 44.1 /100 | #179 | Average 6.1% |
| Immigrants | Nicaragua | 43.9 /100 | #180 | Average 6.1% |
Demographics Similar to Immigrants from the Azores by Ambulatory Disability
In terms of ambulatory disability, the demographic groups most similar to Immigrants from the Azores are Spanish American (7.1%, a difference of 0.17%), Chippewa (7.1%, a difference of 0.17%), Arapaho (7.1%, a difference of 0.28%), Cree (7.1%, a difference of 0.29%), and Iroquois (7.1%, a difference of 0.44%).
| Demographics | Rating | Rank | Ambulatory Disability |
| Immigrants | Armenia | 0.0 /100 | #302 | Tragic 7.0% |
| Africans | 0.0 /100 | #303 | Tragic 7.0% |
| Immigrants | Cabo Verde | 0.0 /100 | #304 | Tragic 7.0% |
| Immigrants | Micronesia | 0.0 /100 | #305 | Tragic 7.0% |
| Iroquois | 0.0 /100 | #306 | Tragic 7.1% |
| Spanish Americans | 0.0 /100 | #307 | Tragic 7.1% |
| Chippewa | 0.0 /100 | #308 | Tragic 7.1% |
| Immigrants | Azores | 0.0 /100 | #309 | Tragic 7.1% |
| Arapaho | 0.0 /100 | #310 | Tragic 7.1% |
| Cree | 0.0 /100 | #311 | Tragic 7.1% |
| Delaware | 0.0 /100 | #312 | Tragic 7.1% |
| Immigrants | Yemen | 0.0 /100 | #313 | Tragic 7.1% |
| Blackfeet | 0.0 /100 | #314 | Tragic 7.1% |
| Shoshone | 0.0 /100 | #315 | Tragic 7.1% |
| Immigrants | Dominican Republic | 0.0 /100 | #316 | Tragic 7.1% |