Italian vs Immigrants from the Azores Ambulatory Disability
COMPARE
Italian
Immigrants from the Azores
Ambulatory Disability
Ambulatory Disability Comparison
Italians
Immigrants from the Azores
6.2%
AMBULATORY DISABILITY
22.6/ 100
METRIC RATING
199th/ 347
METRIC RANK
7.1%
AMBULATORY DISABILITY
0.0/ 100
METRIC RATING
309th/ 347
METRIC RANK
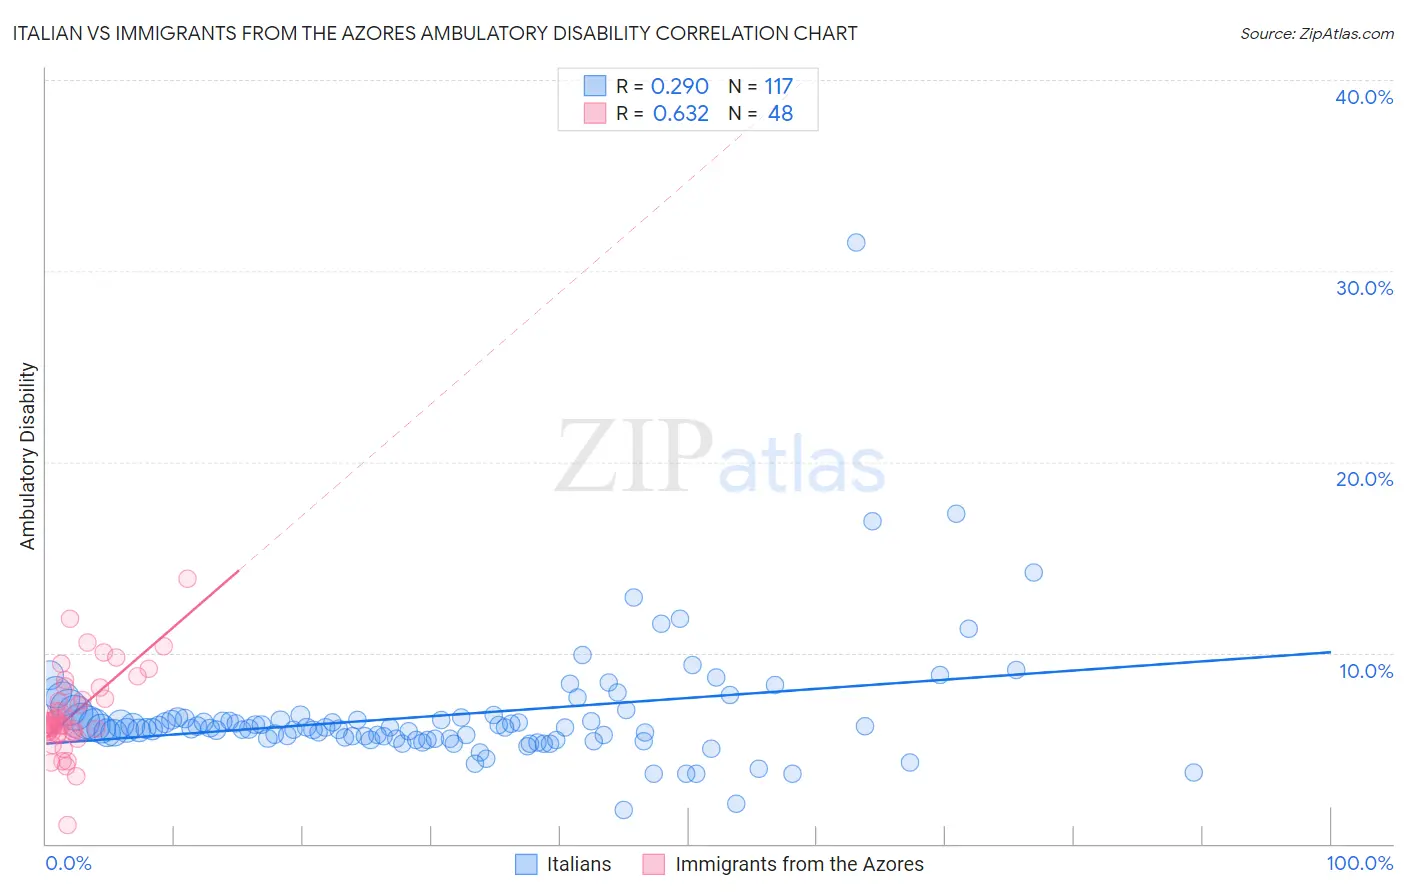
Italian vs Immigrants from the Azores Ambulatory Disability Correlation Chart
The statistical analysis conducted on geographies consisting of 574,457,060 people shows a weak positive correlation between the proportion of Italians and percentage of population with ambulatory disability in the United States with a correlation coefficient (R) of 0.290 and weighted average of 6.2%. Similarly, the statistical analysis conducted on geographies consisting of 46,257,178 people shows a significant positive correlation between the proportion of Immigrants from the Azores and percentage of population with ambulatory disability in the United States with a correlation coefficient (R) of 0.632 and weighted average of 7.1%, a difference of 13.9%.
Ambulatory Disability Correlation Summary
| Measurement | Italian | Immigrants from the Azores |
| Minimum | 1.8% | 0.99% |
| Maximum | 31.5% | 13.9% |
| Range | 29.8% | 12.9% |
| Mean | 6.7% | 6.8% |
| Median | 6.1% | 6.2% |
| Interquartile 25% (IQ1) | 5.5% | 5.9% |
| Interquartile 75% (IQ3) | 6.6% | 7.9% |
| Interquartile Range (IQR) | 1.1% | 2.0% |
| Standard Deviation (Sample) | 3.3% | 2.2% |
| Standard Deviation (Population) | 3.2% | 2.2% |
Similar Demographics by Ambulatory Disability
Demographics Similar to Italians by Ambulatory Disability
In terms of ambulatory disability, the demographic groups most similar to Italians are Immigrants from Cambodia (6.2%, a difference of 0.080%), Immigrants from Bangladesh (6.2%, a difference of 0.14%), Immigrants from Central America (6.2%, a difference of 0.20%), Albanian (6.2%, a difference of 0.22%), and Polish (6.2%, a difference of 0.26%).
| Demographics | Rating | Rank | Ambulatory Disability |
| Immigrants | Western Europe | 31.6 /100 | #192 | Fair 6.2% |
| Guatemalans | 30.0 /100 | #193 | Fair 6.2% |
| Alaska Natives | 29.8 /100 | #194 | Fair 6.2% |
| Belgians | 28.6 /100 | #195 | Fair 6.2% |
| Malaysians | 28.2 /100 | #196 | Fair 6.2% |
| Poles | 26.3 /100 | #197 | Fair 6.2% |
| Immigrants | Bangladesh | 24.6 /100 | #198 | Fair 6.2% |
| Italians | 22.6 /100 | #199 | Fair 6.2% |
| Immigrants | Cambodia | 21.5 /100 | #200 | Fair 6.2% |
| Immigrants | Central America | 20.1 /100 | #201 | Fair 6.2% |
| Albanians | 19.7 /100 | #202 | Poor 6.2% |
| Immigrants | Ukraine | 18.4 /100 | #203 | Poor 6.2% |
| Immigrants | Congo | 18.2 /100 | #204 | Poor 6.2% |
| Slovenes | 18.0 /100 | #205 | Poor 6.2% |
| Finns | 17.2 /100 | #206 | Poor 6.2% |
Demographics Similar to Immigrants from the Azores by Ambulatory Disability
In terms of ambulatory disability, the demographic groups most similar to Immigrants from the Azores are Spanish American (7.1%, a difference of 0.17%), Chippewa (7.1%, a difference of 0.17%), Arapaho (7.1%, a difference of 0.28%), Cree (7.1%, a difference of 0.29%), and Iroquois (7.1%, a difference of 0.44%).
| Demographics | Rating | Rank | Ambulatory Disability |
| Immigrants | Armenia | 0.0 /100 | #302 | Tragic 7.0% |
| Africans | 0.0 /100 | #303 | Tragic 7.0% |
| Immigrants | Cabo Verde | 0.0 /100 | #304 | Tragic 7.0% |
| Immigrants | Micronesia | 0.0 /100 | #305 | Tragic 7.0% |
| Iroquois | 0.0 /100 | #306 | Tragic 7.1% |
| Spanish Americans | 0.0 /100 | #307 | Tragic 7.1% |
| Chippewa | 0.0 /100 | #308 | Tragic 7.1% |
| Immigrants | Azores | 0.0 /100 | #309 | Tragic 7.1% |
| Arapaho | 0.0 /100 | #310 | Tragic 7.1% |
| Cree | 0.0 /100 | #311 | Tragic 7.1% |
| Delaware | 0.0 /100 | #312 | Tragic 7.1% |
| Immigrants | Yemen | 0.0 /100 | #313 | Tragic 7.1% |
| Blackfeet | 0.0 /100 | #314 | Tragic 7.1% |
| Shoshone | 0.0 /100 | #315 | Tragic 7.1% |
| Immigrants | Dominican Republic | 0.0 /100 | #316 | Tragic 7.1% |