Immigrants from Nicaragua vs Tohono O'odham 6th Grade
COMPARE
Immigrants from Nicaragua
Tohono O'odham
6th Grade
6th Grade Comparison
Immigrants from Nicaragua
Tohono O'odham
95.1%
6TH GRADE
0.0/ 100
METRIC RATING
325th/ 347
METRIC RANK
96.5%
6TH GRADE
1.0/ 100
METRIC RATING
248th/ 347
METRIC RANK
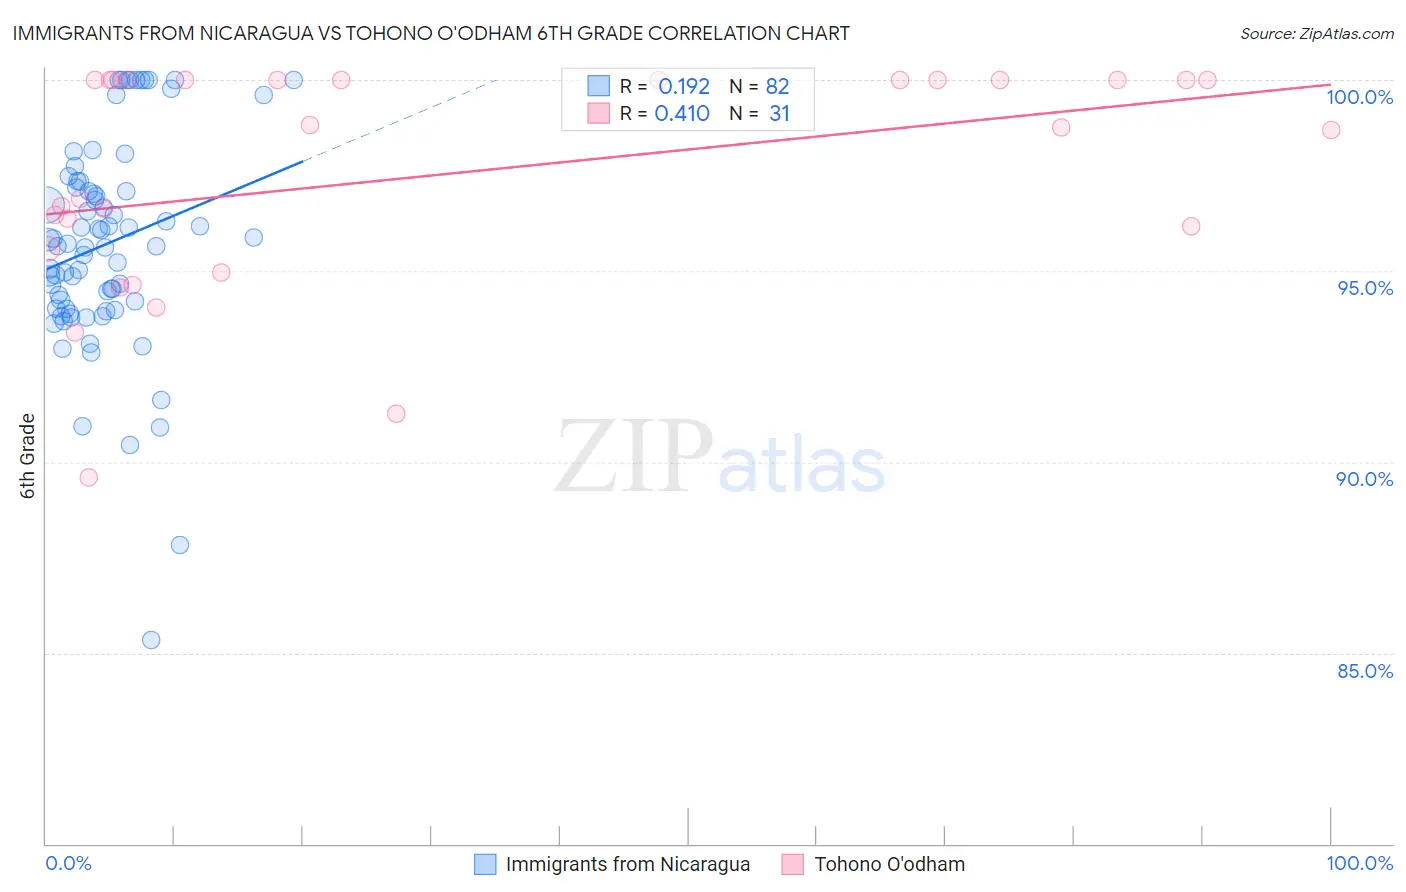
Immigrants from Nicaragua vs Tohono O'odham 6th Grade Correlation Chart
The statistical analysis conducted on geographies consisting of 236,341,411 people shows a poor positive correlation between the proportion of Immigrants from Nicaragua and percentage of population with at least 6th grade education in the United States with a correlation coefficient (R) of 0.192 and weighted average of 95.1%. Similarly, the statistical analysis conducted on geographies consisting of 58,730,615 people shows a moderate positive correlation between the proportion of Tohono O'odham and percentage of population with at least 6th grade education in the United States with a correlation coefficient (R) of 0.410 and weighted average of 96.5%, a difference of 1.5%.
6th Grade Correlation Summary
| Measurement | Immigrants from Nicaragua | Tohono O'odham |
| Minimum | 85.3% | 89.6% |
| Maximum | 100.0% | 100.0% |
| Range | 14.7% | 10.4% |
| Mean | 95.7% | 97.5% |
| Median | 95.7% | 98.8% |
| Interquartile 25% (IQ1) | 94.0% | 95.6% |
| Interquartile 75% (IQ3) | 97.2% | 100.0% |
| Interquartile Range (IQR) | 3.1% | 4.4% |
| Standard Deviation (Sample) | 2.8% | 2.9% |
| Standard Deviation (Population) | 2.8% | 2.9% |
Similar Demographics by 6th Grade
Demographics Similar to Immigrants from Nicaragua by 6th Grade
In terms of 6th grade, the demographic groups most similar to Immigrants from Nicaragua are Cape Verdean (95.1%, a difference of 0.030%), Central American Indian (95.1%, a difference of 0.060%), Immigrants from Cambodia (95.2%, a difference of 0.070%), Hispanic or Latino (95.0%, a difference of 0.070%), and Mexican American Indian (95.0%, a difference of 0.10%).
| Demographics | Rating | Rank | 6th Grade |
| Belizeans | 0.0 /100 | #318 | Tragic 95.3% |
| Immigrants | Belize | 0.0 /100 | #319 | Tragic 95.3% |
| Immigrants | Ecuador | 0.0 /100 | #320 | Tragic 95.3% |
| Immigrants | Fiji | 0.0 /100 | #321 | Tragic 95.2% |
| Immigrants | Cambodia | 0.0 /100 | #322 | Tragic 95.2% |
| Central American Indians | 0.0 /100 | #323 | Tragic 95.1% |
| Cape Verdeans | 0.0 /100 | #324 | Tragic 95.1% |
| Immigrants | Nicaragua | 0.0 /100 | #325 | Tragic 95.1% |
| Hispanics or Latinos | 0.0 /100 | #326 | Tragic 95.0% |
| Mexican American Indians | 0.0 /100 | #327 | Tragic 95.0% |
| Hondurans | 0.0 /100 | #328 | Tragic 95.0% |
| Dominicans | 0.0 /100 | #329 | Tragic 94.9% |
| Nepalese | 0.0 /100 | #330 | Tragic 94.9% |
| Immigrants | Armenia | 0.0 /100 | #331 | Tragic 94.9% |
| Immigrants | Honduras | 0.0 /100 | #332 | Tragic 94.8% |
Demographics Similar to Tohono O'odham by 6th Grade
In terms of 6th grade, the demographic groups most similar to Tohono O'odham are Bolivian (96.5%, a difference of 0.0%), Colombian (96.5%, a difference of 0.0%), Immigrants from Middle Africa (96.5%, a difference of 0.020%), Immigrants from Costa Rica (96.6%, a difference of 0.040%), and Immigrants from Africa (96.6%, a difference of 0.040%).
| Demographics | Rating | Rank | 6th Grade |
| Senegalese | 1.8 /100 | #241 | Tragic 96.6% |
| Immigrants | Asia | 1.8 /100 | #242 | Tragic 96.6% |
| Immigrants | Liberia | 1.6 /100 | #243 | Tragic 96.6% |
| Ethiopians | 1.5 /100 | #244 | Tragic 96.6% |
| Immigrants | Costa Rica | 1.3 /100 | #245 | Tragic 96.6% |
| Immigrants | Africa | 1.3 /100 | #246 | Tragic 96.6% |
| Bolivians | 1.0 /100 | #247 | Tragic 96.5% |
| Tohono O'odham | 1.0 /100 | #248 | Tragic 96.5% |
| Colombians | 0.9 /100 | #249 | Tragic 96.5% |
| Immigrants | Middle Africa | 0.8 /100 | #250 | Tragic 96.5% |
| Immigrants | Senegal | 0.7 /100 | #251 | Tragic 96.5% |
| Immigrants | Uruguay | 0.6 /100 | #252 | Tragic 96.5% |
| Jamaicans | 0.6 /100 | #253 | Tragic 96.5% |
| Immigrants | Ethiopia | 0.6 /100 | #254 | Tragic 96.5% |
| Immigrants | Congo | 0.6 /100 | #255 | Tragic 96.5% |