Bermudan vs Tohono O'odham Self-Care Disability
COMPARE
Bermudan
Tohono O'odham
Self-Care Disability
Self-Care Disability Comparison
Bermudans
Tohono O'odham
2.6%
SELF-CARE DISABILITY
1.9/ 100
METRIC RATING
236th/ 347
METRIC RANK
3.1%
SELF-CARE DISABILITY
0.0/ 100
METRIC RATING
343rd/ 347
METRIC RANK
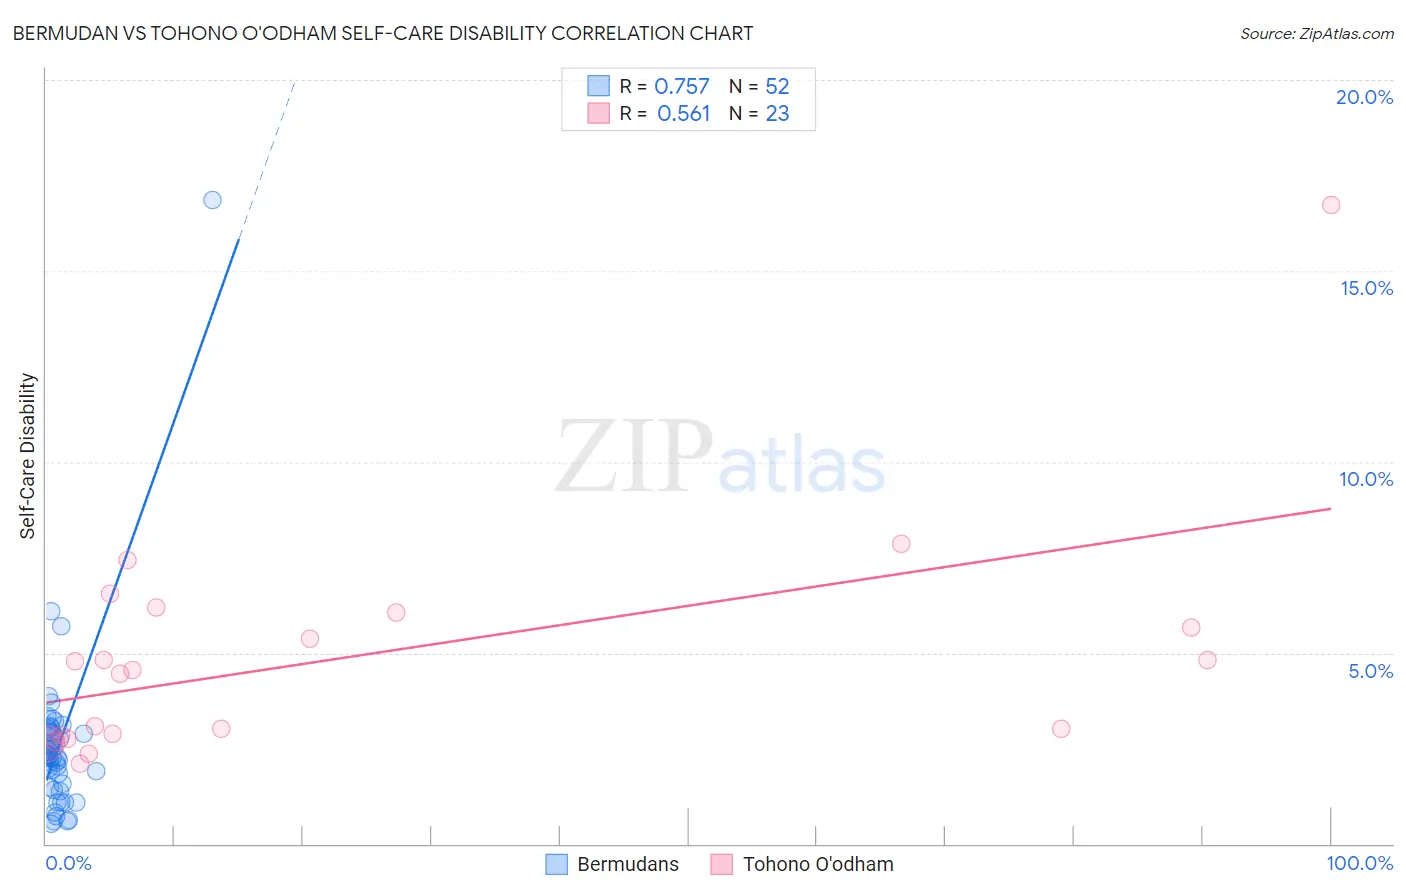
Bermudan vs Tohono O'odham Self-Care Disability Correlation Chart
The statistical analysis conducted on geographies consisting of 55,721,549 people shows a strong positive correlation between the proportion of Bermudans and percentage of population with self-care disability in the United States with a correlation coefficient (R) of 0.757 and weighted average of 2.6%. Similarly, the statistical analysis conducted on geographies consisting of 58,708,856 people shows a substantial positive correlation between the proportion of Tohono O'odham and percentage of population with self-care disability in the United States with a correlation coefficient (R) of 0.561 and weighted average of 3.1%, a difference of 20.7%.
Self-Care Disability Correlation Summary
| Measurement | Bermudan | Tohono O'odham |
| Minimum | 0.52% | 2.1% |
| Maximum | 16.9% | 16.7% |
| Range | 16.3% | 14.6% |
| Mean | 2.6% | 4.9% |
| Median | 2.3% | 4.5% |
| Interquartile 25% (IQ1) | 1.5% | 2.9% |
| Interquartile 75% (IQ3) | 2.9% | 6.1% |
| Interquartile Range (IQR) | 1.4% | 3.2% |
| Standard Deviation (Sample) | 2.3% | 3.1% |
| Standard Deviation (Population) | 2.3% | 3.0% |
Similar Demographics by Self-Care Disability
Demographics Similar to Bermudans by Self-Care Disability
In terms of self-care disability, the demographic groups most similar to Bermudans are Bahamian (2.6%, a difference of 0.070%), Vietnamese (2.6%, a difference of 0.10%), Liberian (2.6%, a difference of 0.11%), Albanian (2.6%, a difference of 0.15%), and Immigrants from Guatemala (2.6%, a difference of 0.18%).
| Demographics | Rating | Rank | Self-Care Disability |
| Guamanians/Chamorros | 2.5 /100 | #229 | Tragic 2.6% |
| Immigrants | Ecuador | 2.5 /100 | #230 | Tragic 2.6% |
| Immigrants | Guatemala | 2.2 /100 | #231 | Tragic 2.6% |
| Albanians | 2.2 /100 | #232 | Tragic 2.6% |
| Liberians | 2.1 /100 | #233 | Tragic 2.6% |
| Vietnamese | 2.1 /100 | #234 | Tragic 2.6% |
| Bahamians | 2.0 /100 | #235 | Tragic 2.6% |
| Bermudans | 1.9 /100 | #236 | Tragic 2.6% |
| Immigrants | Senegal | 1.6 /100 | #237 | Tragic 2.6% |
| Senegalese | 1.3 /100 | #238 | Tragic 2.6% |
| Immigrants | Panama | 1.2 /100 | #239 | Tragic 2.6% |
| Marshallese | 1.2 /100 | #240 | Tragic 2.6% |
| Immigrants | Syria | 1.0 /100 | #241 | Tragic 2.6% |
| Spanish | 0.8 /100 | #242 | Tragic 2.6% |
| Hawaiians | 0.8 /100 | #243 | Tragic 2.6% |
Demographics Similar to Tohono O'odham by Self-Care Disability
In terms of self-care disability, the demographic groups most similar to Tohono O'odham are Colville (3.1%, a difference of 0.11%), Dominican (3.1%, a difference of 1.7%), Immigrants from Cabo Verde (3.1%, a difference of 2.0%), Immigrants from Dominican Republic (3.0%, a difference of 2.3%), and Cape Verdean (3.0%, a difference of 2.7%).
| Demographics | Rating | Rank | Self-Care Disability |
| Dutch West Indians | 0.0 /100 | #333 | Tragic 3.0% |
| Houma | 0.0 /100 | #334 | Tragic 3.0% |
| Immigrants | Azores | 0.0 /100 | #335 | Tragic 3.0% |
| Immigrants | Yemen | 0.0 /100 | #336 | Tragic 3.0% |
| Choctaw | 0.0 /100 | #337 | Tragic 3.0% |
| Cape Verdeans | 0.0 /100 | #338 | Tragic 3.0% |
| Immigrants | Dominican Republic | 0.0 /100 | #339 | Tragic 3.0% |
| Immigrants | Cabo Verde | 0.0 /100 | #340 | Tragic 3.1% |
| Dominicans | 0.0 /100 | #341 | Tragic 3.1% |
| Colville | 0.0 /100 | #342 | Tragic 3.1% |
| Tohono O'odham | 0.0 /100 | #343 | Tragic 3.1% |
| Pueblo | 0.0 /100 | #344 | Tragic 3.3% |
| Armenians | 0.0 /100 | #345 | Tragic 3.4% |
| Puerto Ricans | 0.0 /100 | #346 | Tragic 3.7% |
| Immigrants | Armenia | 0.0 /100 | #347 | Tragic 4.2% |