Immigrants from West Indies vs Tohono O'odham Self-Care Disability
COMPARE
Immigrants from West Indies
Tohono O'odham
Self-Care Disability
Self-Care Disability Comparison
Immigrants from West Indies
Tohono O'odham
2.8%
SELF-CARE DISABILITY
0.0/ 100
METRIC RATING
305th/ 347
METRIC RANK
3.1%
SELF-CARE DISABILITY
0.0/ 100
METRIC RATING
343rd/ 347
METRIC RANK
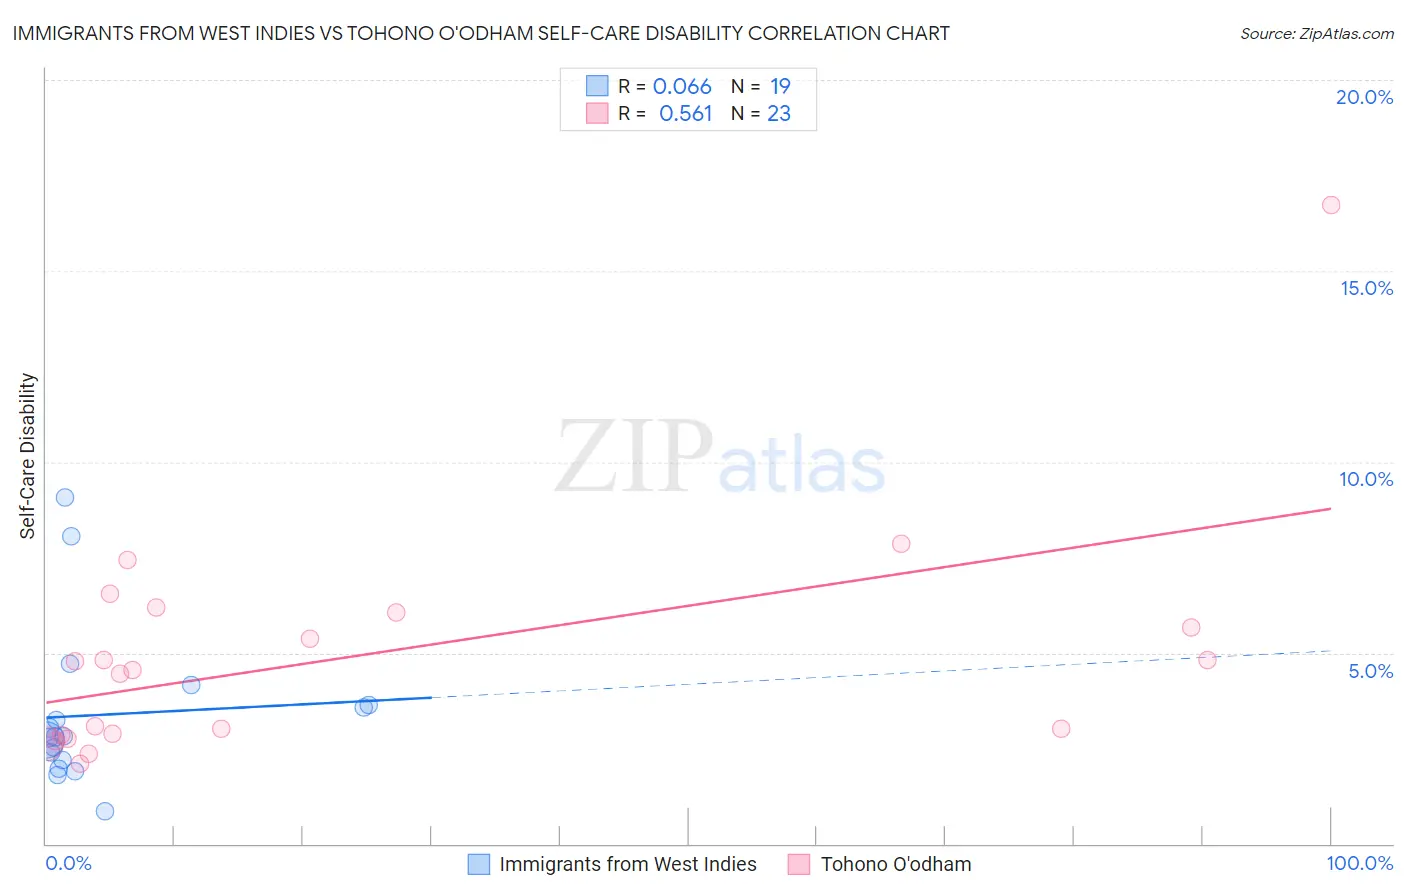
Immigrants from West Indies vs Tohono O'odham Self-Care Disability Correlation Chart
The statistical analysis conducted on geographies consisting of 72,451,544 people shows a slight positive correlation between the proportion of Immigrants from West Indies and percentage of population with self-care disability in the United States with a correlation coefficient (R) of 0.066 and weighted average of 2.8%. Similarly, the statistical analysis conducted on geographies consisting of 58,708,856 people shows a substantial positive correlation between the proportion of Tohono O'odham and percentage of population with self-care disability in the United States with a correlation coefficient (R) of 0.561 and weighted average of 3.1%, a difference of 11.6%.
Self-Care Disability Correlation Summary
| Measurement | Immigrants from West Indies | Tohono O'odham |
| Minimum | 0.84% | 2.1% |
| Maximum | 9.1% | 16.7% |
| Range | 8.2% | 14.6% |
| Mean | 3.4% | 4.9% |
| Median | 2.8% | 4.5% |
| Interquartile 25% (IQ1) | 2.2% | 2.9% |
| Interquartile 75% (IQ3) | 3.6% | 6.1% |
| Interquartile Range (IQR) | 1.4% | 3.2% |
| Standard Deviation (Sample) | 2.0% | 3.1% |
| Standard Deviation (Population) | 2.0% | 3.0% |
Similar Demographics by Self-Care Disability
Demographics Similar to Immigrants from West Indies by Self-Care Disability
In terms of self-care disability, the demographic groups most similar to Immigrants from West Indies are Cree (2.8%, a difference of 0.050%), Immigrants from Belize (2.8%, a difference of 0.20%), Immigrants from St. Vincent and the Grenadines (2.8%, a difference of 0.35%), Pima (2.8%, a difference of 0.39%), and Aleut (2.8%, a difference of 0.40%).
| Demographics | Rating | Rank | Self-Care Disability |
| Americans | 0.0 /100 | #298 | Tragic 2.8% |
| Immigrants | Guyana | 0.0 /100 | #299 | Tragic 2.8% |
| Immigrants | Fiji | 0.0 /100 | #300 | Tragic 2.8% |
| Pima | 0.0 /100 | #301 | Tragic 2.8% |
| Immigrants | St. Vincent and the Grenadines | 0.0 /100 | #302 | Tragic 2.8% |
| Immigrants | Belize | 0.0 /100 | #303 | Tragic 2.8% |
| Cree | 0.0 /100 | #304 | Tragic 2.8% |
| Immigrants | West Indies | 0.0 /100 | #305 | Tragic 2.8% |
| Aleuts | 0.0 /100 | #306 | Tragic 2.8% |
| Natives/Alaskans | 0.0 /100 | #307 | Tragic 2.8% |
| Immigrants | Grenada | 0.0 /100 | #308 | Tragic 2.8% |
| Bangladeshis | 0.0 /100 | #309 | Tragic 2.8% |
| British West Indians | 0.0 /100 | #310 | Tragic 2.8% |
| Puget Sound Salish | 0.0 /100 | #311 | Tragic 2.8% |
| Immigrants | Caribbean | 0.0 /100 | #312 | Tragic 2.8% |
Demographics Similar to Tohono O'odham by Self-Care Disability
In terms of self-care disability, the demographic groups most similar to Tohono O'odham are Colville (3.1%, a difference of 0.11%), Dominican (3.1%, a difference of 1.7%), Immigrants from Cabo Verde (3.1%, a difference of 2.0%), Immigrants from Dominican Republic (3.0%, a difference of 2.3%), and Cape Verdean (3.0%, a difference of 2.7%).
| Demographics | Rating | Rank | Self-Care Disability |
| Dutch West Indians | 0.0 /100 | #333 | Tragic 3.0% |
| Houma | 0.0 /100 | #334 | Tragic 3.0% |
| Immigrants | Azores | 0.0 /100 | #335 | Tragic 3.0% |
| Immigrants | Yemen | 0.0 /100 | #336 | Tragic 3.0% |
| Choctaw | 0.0 /100 | #337 | Tragic 3.0% |
| Cape Verdeans | 0.0 /100 | #338 | Tragic 3.0% |
| Immigrants | Dominican Republic | 0.0 /100 | #339 | Tragic 3.0% |
| Immigrants | Cabo Verde | 0.0 /100 | #340 | Tragic 3.1% |
| Dominicans | 0.0 /100 | #341 | Tragic 3.1% |
| Colville | 0.0 /100 | #342 | Tragic 3.1% |
| Tohono O'odham | 0.0 /100 | #343 | Tragic 3.1% |
| Pueblo | 0.0 /100 | #344 | Tragic 3.3% |
| Armenians | 0.0 /100 | #345 | Tragic 3.4% |
| Puerto Ricans | 0.0 /100 | #346 | Tragic 3.7% |
| Immigrants | Armenia | 0.0 /100 | #347 | Tragic 4.2% |