Immigrants from Nepal vs White/Caucasian Ambulatory Disability
COMPARE
Immigrants from Nepal
White/Caucasian
Ambulatory Disability
Ambulatory Disability Comparison
Immigrants from Nepal
Whites/Caucasians
5.4%
AMBULATORY DISABILITY
100.0/ 100
METRIC RATING
26th/ 347
METRIC RANK
6.7%
AMBULATORY DISABILITY
0.1/ 100
METRIC RATING
273rd/ 347
METRIC RANK
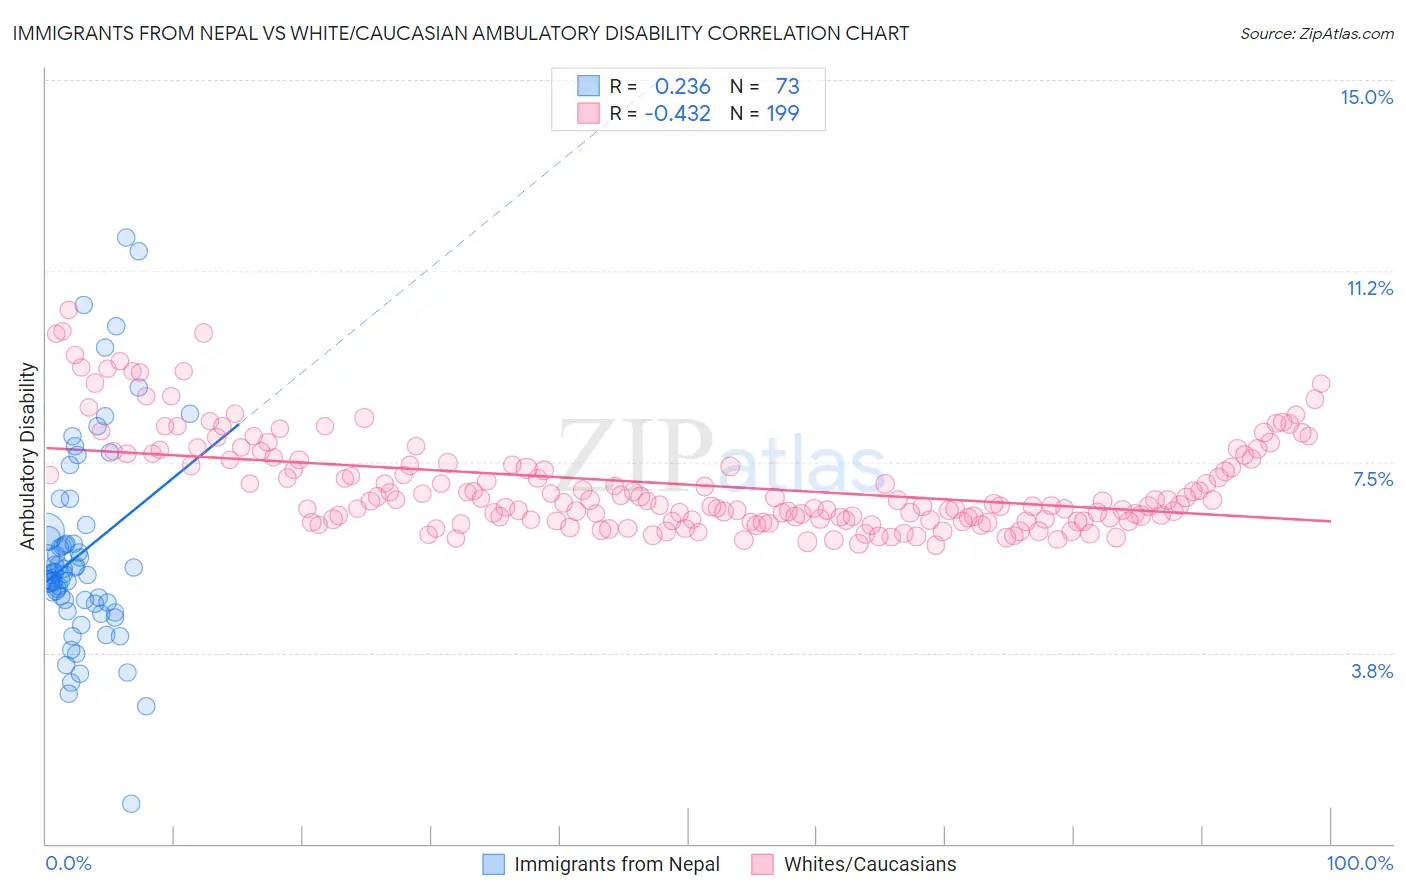
Immigrants from Nepal vs White/Caucasian Ambulatory Disability Correlation Chart
The statistical analysis conducted on geographies consisting of 186,771,176 people shows a weak positive correlation between the proportion of Immigrants from Nepal and percentage of population with ambulatory disability in the United States with a correlation coefficient (R) of 0.236 and weighted average of 5.4%. Similarly, the statistical analysis conducted on geographies consisting of 582,664,974 people shows a moderate negative correlation between the proportion of Whites/Caucasians and percentage of population with ambulatory disability in the United States with a correlation coefficient (R) of -0.432 and weighted average of 6.7%, a difference of 24.0%.
Ambulatory Disability Correlation Summary
| Measurement | Immigrants from Nepal | White/Caucasian |
| Minimum | 0.79% | 5.9% |
| Maximum | 11.9% | 10.5% |
| Range | 11.1% | 4.6% |
| Mean | 5.7% | 7.1% |
| Median | 5.3% | 6.7% |
| Interquartile 25% (IQ1) | 4.7% | 6.4% |
| Interquartile 75% (IQ3) | 6.1% | 7.6% |
| Interquartile Range (IQR) | 1.3% | 1.2% |
| Standard Deviation (Sample) | 2.0% | 0.96% |
| Standard Deviation (Population) | 2.0% | 0.96% |
Similar Demographics by Ambulatory Disability
Demographics Similar to Immigrants from Nepal by Ambulatory Disability
In terms of ambulatory disability, the demographic groups most similar to Immigrants from Nepal are Zimbabwean (5.4%, a difference of 0.030%), Immigrants from Saudi Arabia (5.4%, a difference of 0.11%), Asian (5.4%, a difference of 0.16%), Tongan (5.4%, a difference of 0.20%), and Cambodian (5.4%, a difference of 0.22%).
| Demographics | Rating | Rank | Ambulatory Disability |
| Indians (Asian) | 100.0 /100 | #19 | Exceptional 5.4% |
| Ethiopians | 100.0 /100 | #20 | Exceptional 5.4% |
| Immigrants | Kuwait | 100.0 /100 | #21 | Exceptional 5.4% |
| Immigrants | Israel | 100.0 /100 | #22 | Exceptional 5.4% |
| Tongans | 100.0 /100 | #23 | Exceptional 5.4% |
| Immigrants | Saudi Arabia | 100.0 /100 | #24 | Exceptional 5.4% |
| Zimbabweans | 100.0 /100 | #25 | Exceptional 5.4% |
| Immigrants | Nepal | 100.0 /100 | #26 | Exceptional 5.4% |
| Asians | 100.0 /100 | #27 | Exceptional 5.4% |
| Cambodians | 100.0 /100 | #28 | Exceptional 5.4% |
| Immigrants | Iran | 100.0 /100 | #29 | Exceptional 5.4% |
| Immigrants | Turkey | 100.0 /100 | #30 | Exceptional 5.4% |
| Immigrants | Venezuela | 100.0 /100 | #31 | Exceptional 5.4% |
| Immigrants | Australia | 100.0 /100 | #32 | Exceptional 5.5% |
| Immigrants | Pakistan | 100.0 /100 | #33 | Exceptional 5.5% |
Demographics Similar to Whites/Caucasians by Ambulatory Disability
In terms of ambulatory disability, the demographic groups most similar to Whites/Caucasians are French Canadian (6.7%, a difference of 0.020%), Sioux (6.7%, a difference of 0.24%), Immigrants from Guyana (6.7%, a difference of 0.31%), Celtic (6.7%, a difference of 0.34%), and Immigrants from Trinidad and Tobago (6.7%, a difference of 0.38%).
| Demographics | Rating | Rank | Ambulatory Disability |
| Guyanese | 0.2 /100 | #266 | Tragic 6.6% |
| Trinidadians and Tobagonians | 0.2 /100 | #267 | Tragic 6.6% |
| Spanish | 0.2 /100 | #268 | Tragic 6.6% |
| French | 0.1 /100 | #269 | Tragic 6.6% |
| Slovaks | 0.1 /100 | #270 | Tragic 6.7% |
| Immigrants | Trinidad and Tobago | 0.1 /100 | #271 | Tragic 6.7% |
| French Canadians | 0.1 /100 | #272 | Tragic 6.7% |
| Whites/Caucasians | 0.1 /100 | #273 | Tragic 6.7% |
| Sioux | 0.1 /100 | #274 | Tragic 6.7% |
| Immigrants | Guyana | 0.1 /100 | #275 | Tragic 6.7% |
| Celtics | 0.1 /100 | #276 | Tragic 6.7% |
| Jamaicans | 0.1 /100 | #277 | Tragic 6.7% |
| Immigrants | West Indies | 0.1 /100 | #278 | Tragic 6.7% |
| Immigrants | Caribbean | 0.0 /100 | #279 | Tragic 6.7% |
| Pennsylvania Germans | 0.0 /100 | #280 | Tragic 6.8% |