Immigrants from Jamaica vs White/Caucasian Ambulatory Disability
COMPARE
Immigrants from Jamaica
White/Caucasian
Ambulatory Disability
Ambulatory Disability Comparison
Immigrants from Jamaica
Whites/Caucasians
6.8%
AMBULATORY DISABILITY
0.0/ 100
METRIC RATING
284th/ 347
METRIC RANK
6.7%
AMBULATORY DISABILITY
0.1/ 100
METRIC RATING
273rd/ 347
METRIC RANK
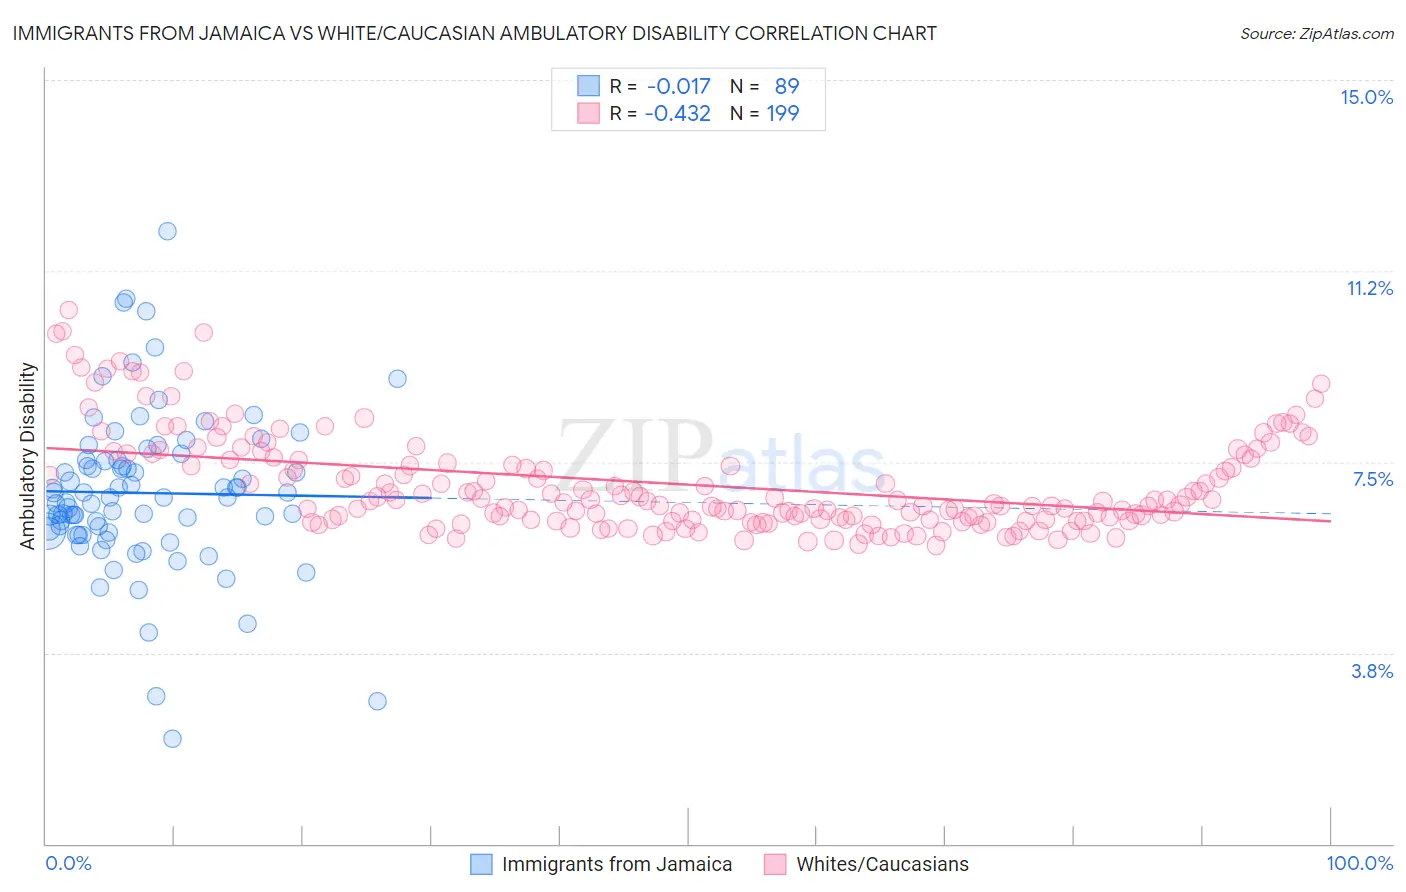
Immigrants from Jamaica vs White/Caucasian Ambulatory Disability Correlation Chart
The statistical analysis conducted on geographies consisting of 301,698,027 people shows no correlation between the proportion of Immigrants from Jamaica and percentage of population with ambulatory disability in the United States with a correlation coefficient (R) of -0.017 and weighted average of 6.8%. Similarly, the statistical analysis conducted on geographies consisting of 582,664,974 people shows a moderate negative correlation between the proportion of Whites/Caucasians and percentage of population with ambulatory disability in the United States with a correlation coefficient (R) of -0.432 and weighted average of 6.7%, a difference of 1.3%.
Ambulatory Disability Correlation Summary
| Measurement | Immigrants from Jamaica | White/Caucasian |
| Minimum | 2.1% | 5.9% |
| Maximum | 12.0% | 10.5% |
| Range | 10.0% | 4.6% |
| Mean | 6.9% | 7.1% |
| Median | 6.8% | 6.7% |
| Interquartile 25% (IQ1) | 6.1% | 6.4% |
| Interquartile 75% (IQ3) | 7.5% | 7.6% |
| Interquartile Range (IQR) | 1.4% | 1.2% |
| Standard Deviation (Sample) | 1.6% | 0.96% |
| Standard Deviation (Population) | 1.6% | 0.96% |
Demographics Similar to Immigrants from Jamaica and Whites/Caucasians by Ambulatory Disability
In terms of ambulatory disability, the demographic groups most similar to Immigrants from Jamaica are Immigrants from Barbados (6.8%, a difference of 0.070%), Barbadian (6.8%, a difference of 0.23%), Yaqui (6.8%, a difference of 0.35%), Fijian (6.8%, a difference of 0.41%), and Pennsylvania German (6.8%, a difference of 0.42%). Similarly, the demographic groups most similar to Whites/Caucasians are French Canadian (6.7%, a difference of 0.020%), Sioux (6.7%, a difference of 0.24%), Immigrants from Guyana (6.7%, a difference of 0.31%), Celtic (6.7%, a difference of 0.34%), and Immigrants from Trinidad and Tobago (6.7%, a difference of 0.38%).
| Demographics | Rating | Rank | Ambulatory Disability |
| Spanish | 0.2 /100 | #268 | Tragic 6.6% |
| French | 0.1 /100 | #269 | Tragic 6.6% |
| Slovaks | 0.1 /100 | #270 | Tragic 6.7% |
| Immigrants | Trinidad and Tobago | 0.1 /100 | #271 | Tragic 6.7% |
| French Canadians | 0.1 /100 | #272 | Tragic 6.7% |
| Whites/Caucasians | 0.1 /100 | #273 | Tragic 6.7% |
| Sioux | 0.1 /100 | #274 | Tragic 6.7% |
| Immigrants | Guyana | 0.1 /100 | #275 | Tragic 6.7% |
| Celtics | 0.1 /100 | #276 | Tragic 6.7% |
| Jamaicans | 0.1 /100 | #277 | Tragic 6.7% |
| Immigrants | West Indies | 0.1 /100 | #278 | Tragic 6.7% |
| Immigrants | Caribbean | 0.0 /100 | #279 | Tragic 6.7% |
| Pennsylvania Germans | 0.0 /100 | #280 | Tragic 6.8% |
| Yaqui | 0.0 /100 | #281 | Tragic 6.8% |
| Barbadians | 0.0 /100 | #282 | Tragic 6.8% |
| Immigrants | Barbados | 0.0 /100 | #283 | Tragic 6.8% |
| Immigrants | Jamaica | 0.0 /100 | #284 | Tragic 6.8% |
| Fijians | 0.0 /100 | #285 | Tragic 6.8% |
| Yakama | 0.0 /100 | #286 | Tragic 6.8% |
| U.S. Virgin Islanders | 0.0 /100 | #287 | Tragic 6.8% |
| Immigrants | Nonimmigrants | 0.0 /100 | #288 | Tragic 6.9% |