Ugandan vs White/Caucasian Ambulatory Disability
COMPARE
Ugandan
White/Caucasian
Ambulatory Disability
Ambulatory Disability Comparison
Ugandans
Whites/Caucasians
5.7%
AMBULATORY DISABILITY
99.2/ 100
METRIC RATING
84th/ 347
METRIC RANK
6.7%
AMBULATORY DISABILITY
0.1/ 100
METRIC RATING
273rd/ 347
METRIC RANK
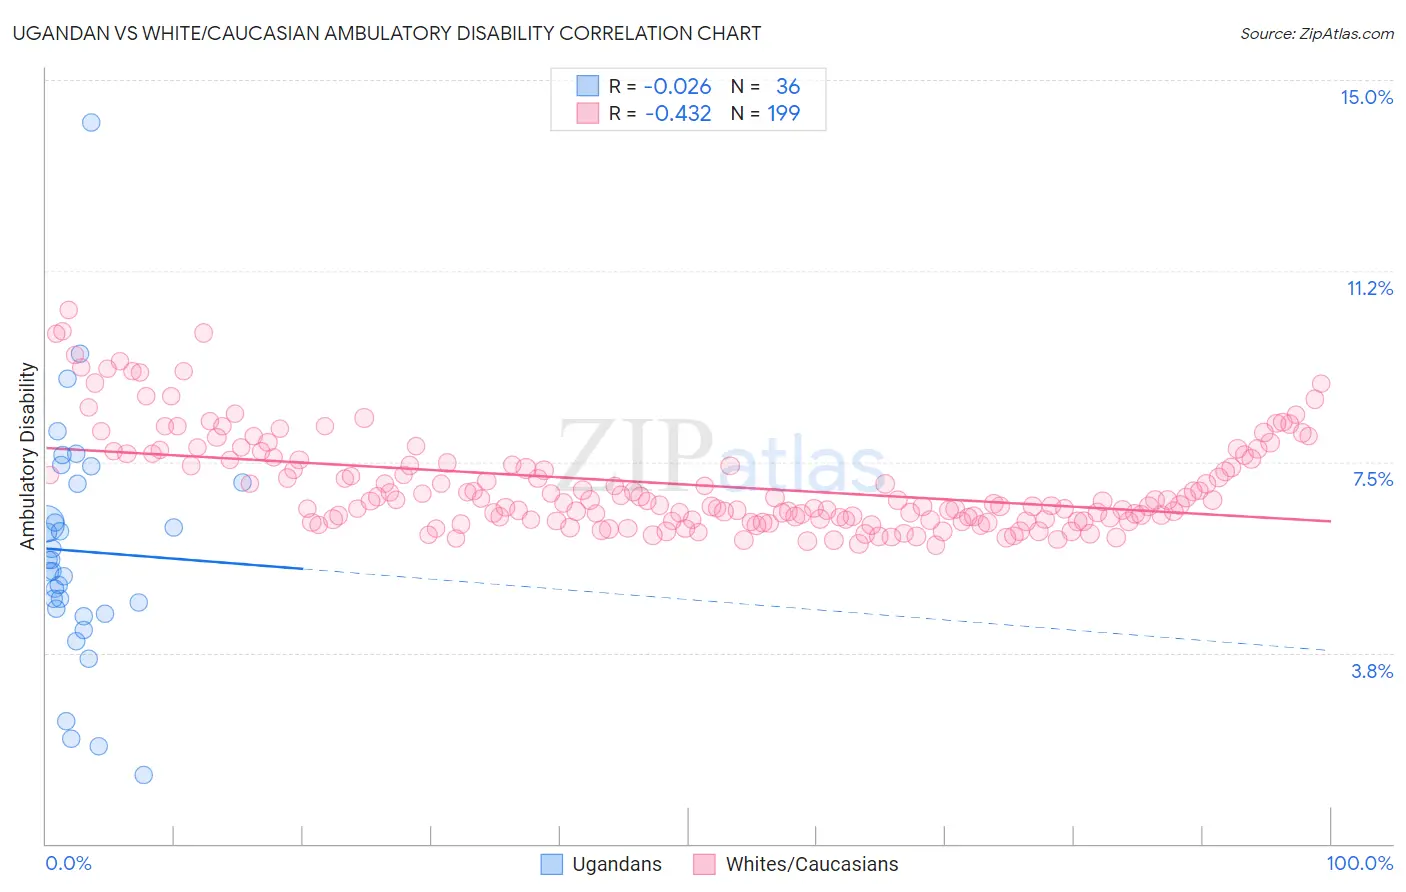
Ugandan vs White/Caucasian Ambulatory Disability Correlation Chart
The statistical analysis conducted on geographies consisting of 94,018,396 people shows no correlation between the proportion of Ugandans and percentage of population with ambulatory disability in the United States with a correlation coefficient (R) of -0.026 and weighted average of 5.7%. Similarly, the statistical analysis conducted on geographies consisting of 582,664,974 people shows a moderate negative correlation between the proportion of Whites/Caucasians and percentage of population with ambulatory disability in the United States with a correlation coefficient (R) of -0.432 and weighted average of 6.7%, a difference of 16.7%.
Ambulatory Disability Correlation Summary
| Measurement | Ugandan | White/Caucasian |
| Minimum | 1.4% | 5.9% |
| Maximum | 14.2% | 10.5% |
| Range | 12.8% | 4.6% |
| Mean | 5.7% | 7.1% |
| Median | 5.5% | 6.7% |
| Interquartile 25% (IQ1) | 4.6% | 6.4% |
| Interquartile 75% (IQ3) | 7.1% | 7.6% |
| Interquartile Range (IQR) | 2.5% | 1.2% |
| Standard Deviation (Sample) | 2.4% | 0.96% |
| Standard Deviation (Population) | 2.3% | 0.96% |
Similar Demographics by Ambulatory Disability
Demographics Similar to Ugandans by Ambulatory Disability
In terms of ambulatory disability, the demographic groups most similar to Ugandans are Eastern European (5.7%, a difference of 0.0%), Palestinian (5.7%, a difference of 0.020%), Immigrants from Ireland (5.7%, a difference of 0.030%), Immigrants from Jordan (5.7%, a difference of 0.030%), and Chilean (5.7%, a difference of 0.16%).
| Demographics | Rating | Rank | Ambulatory Disability |
| Immigrants | Vietnam | 99.3 /100 | #77 | Exceptional 5.7% |
| Somalis | 99.2 /100 | #78 | Exceptional 5.7% |
| Chileans | 99.2 /100 | #79 | Exceptional 5.7% |
| Immigrants | Ireland | 99.2 /100 | #80 | Exceptional 5.7% |
| Immigrants | Jordan | 99.2 /100 | #81 | Exceptional 5.7% |
| Palestinians | 99.2 /100 | #82 | Exceptional 5.7% |
| Eastern Europeans | 99.2 /100 | #83 | Exceptional 5.7% |
| Ugandans | 99.2 /100 | #84 | Exceptional 5.7% |
| South Americans | 99.0 /100 | #85 | Exceptional 5.7% |
| Latvians | 99.0 /100 | #86 | Exceptional 5.7% |
| Immigrants | Chile | 98.9 /100 | #87 | Exceptional 5.8% |
| Soviet Union | 98.9 /100 | #88 | Exceptional 5.8% |
| Bhutanese | 98.8 /100 | #89 | Exceptional 5.8% |
| Australians | 98.8 /100 | #90 | Exceptional 5.8% |
| Immigrants | Sudan | 98.8 /100 | #91 | Exceptional 5.8% |
Demographics Similar to Whites/Caucasians by Ambulatory Disability
In terms of ambulatory disability, the demographic groups most similar to Whites/Caucasians are French Canadian (6.7%, a difference of 0.020%), Sioux (6.7%, a difference of 0.24%), Immigrants from Guyana (6.7%, a difference of 0.31%), Celtic (6.7%, a difference of 0.34%), and Immigrants from Trinidad and Tobago (6.7%, a difference of 0.38%).
| Demographics | Rating | Rank | Ambulatory Disability |
| Guyanese | 0.2 /100 | #266 | Tragic 6.6% |
| Trinidadians and Tobagonians | 0.2 /100 | #267 | Tragic 6.6% |
| Spanish | 0.2 /100 | #268 | Tragic 6.6% |
| French | 0.1 /100 | #269 | Tragic 6.6% |
| Slovaks | 0.1 /100 | #270 | Tragic 6.7% |
| Immigrants | Trinidad and Tobago | 0.1 /100 | #271 | Tragic 6.7% |
| French Canadians | 0.1 /100 | #272 | Tragic 6.7% |
| Whites/Caucasians | 0.1 /100 | #273 | Tragic 6.7% |
| Sioux | 0.1 /100 | #274 | Tragic 6.7% |
| Immigrants | Guyana | 0.1 /100 | #275 | Tragic 6.7% |
| Celtics | 0.1 /100 | #276 | Tragic 6.7% |
| Jamaicans | 0.1 /100 | #277 | Tragic 6.7% |
| Immigrants | West Indies | 0.1 /100 | #278 | Tragic 6.7% |
| Immigrants | Caribbean | 0.0 /100 | #279 | Tragic 6.7% |
| Pennsylvania Germans | 0.0 /100 | #280 | Tragic 6.8% |