Immigrants from Nepal vs Belizean Ambulatory Disability
COMPARE
Immigrants from Nepal
Belizean
Ambulatory Disability
Ambulatory Disability Comparison
Immigrants from Nepal
Belizeans
5.4%
AMBULATORY DISABILITY
100.0/ 100
METRIC RATING
26th/ 347
METRIC RANK
6.5%
AMBULATORY DISABILITY
0.7/ 100
METRIC RATING
254th/ 347
METRIC RANK
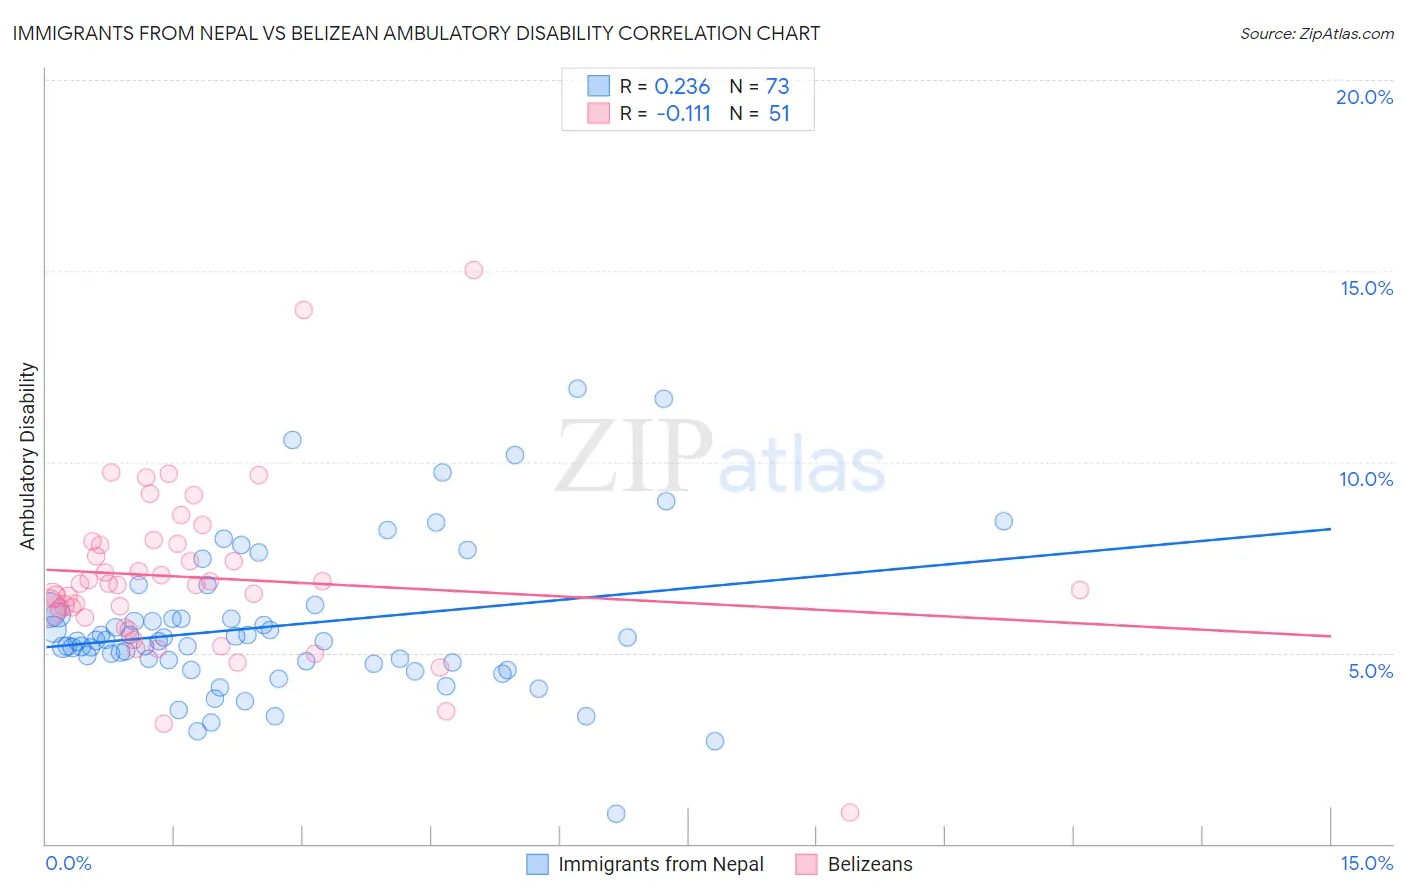
Immigrants from Nepal vs Belizean Ambulatory Disability Correlation Chart
The statistical analysis conducted on geographies consisting of 186,771,176 people shows a weak positive correlation between the proportion of Immigrants from Nepal and percentage of population with ambulatory disability in the United States with a correlation coefficient (R) of 0.236 and weighted average of 5.4%. Similarly, the statistical analysis conducted on geographies consisting of 144,187,232 people shows a poor negative correlation between the proportion of Belizeans and percentage of population with ambulatory disability in the United States with a correlation coefficient (R) of -0.111 and weighted average of 6.5%, a difference of 20.9%.
Ambulatory Disability Correlation Summary
| Measurement | Immigrants from Nepal | Belizean |
| Minimum | 0.79% | 0.81% |
| Maximum | 11.9% | 15.0% |
| Range | 11.1% | 14.2% |
| Mean | 5.7% | 7.0% |
| Median | 5.3% | 6.8% |
| Interquartile 25% (IQ1) | 4.7% | 5.9% |
| Interquartile 75% (IQ3) | 6.1% | 7.9% |
| Interquartile Range (IQR) | 1.3% | 1.9% |
| Standard Deviation (Sample) | 2.0% | 2.3% |
| Standard Deviation (Population) | 2.0% | 2.3% |
Similar Demographics by Ambulatory Disability
Demographics Similar to Immigrants from Nepal by Ambulatory Disability
In terms of ambulatory disability, the demographic groups most similar to Immigrants from Nepal are Zimbabwean (5.4%, a difference of 0.030%), Immigrants from Saudi Arabia (5.4%, a difference of 0.11%), Asian (5.4%, a difference of 0.16%), Tongan (5.4%, a difference of 0.20%), and Cambodian (5.4%, a difference of 0.22%).
| Demographics | Rating | Rank | Ambulatory Disability |
| Indians (Asian) | 100.0 /100 | #19 | Exceptional 5.4% |
| Ethiopians | 100.0 /100 | #20 | Exceptional 5.4% |
| Immigrants | Kuwait | 100.0 /100 | #21 | Exceptional 5.4% |
| Immigrants | Israel | 100.0 /100 | #22 | Exceptional 5.4% |
| Tongans | 100.0 /100 | #23 | Exceptional 5.4% |
| Immigrants | Saudi Arabia | 100.0 /100 | #24 | Exceptional 5.4% |
| Zimbabweans | 100.0 /100 | #25 | Exceptional 5.4% |
| Immigrants | Nepal | 100.0 /100 | #26 | Exceptional 5.4% |
| Asians | 100.0 /100 | #27 | Exceptional 5.4% |
| Cambodians | 100.0 /100 | #28 | Exceptional 5.4% |
| Immigrants | Iran | 100.0 /100 | #29 | Exceptional 5.4% |
| Immigrants | Turkey | 100.0 /100 | #30 | Exceptional 5.4% |
| Immigrants | Venezuela | 100.0 /100 | #31 | Exceptional 5.4% |
| Immigrants | Australia | 100.0 /100 | #32 | Exceptional 5.5% |
| Immigrants | Pakistan | 100.0 /100 | #33 | Exceptional 5.5% |
Demographics Similar to Belizeans by Ambulatory Disability
In terms of ambulatory disability, the demographic groups most similar to Belizeans are Welsh (6.5%, a difference of 0.070%), Immigrants from Uzbekistan (6.5%, a difference of 0.15%), Scottish (6.5%, a difference of 0.16%), Immigrants from Bahamas (6.5%, a difference of 0.21%), and Bermudan (6.5%, a difference of 0.23%).
| Demographics | Rating | Rank | Ambulatory Disability |
| Immigrants | Cuba | 1.4 /100 | #247 | Tragic 6.5% |
| Immigrants | Portugal | 1.4 /100 | #248 | Tragic 6.5% |
| Native Hawaiians | 1.1 /100 | #249 | Tragic 6.5% |
| Chinese | 1.0 /100 | #250 | Tragic 6.5% |
| Hawaiians | 0.9 /100 | #251 | Tragic 6.5% |
| Immigrants | Bahamas | 0.8 /100 | #252 | Tragic 6.5% |
| Scottish | 0.7 /100 | #253 | Tragic 6.5% |
| Belizeans | 0.7 /100 | #254 | Tragic 6.5% |
| Welsh | 0.6 /100 | #255 | Tragic 6.5% |
| Immigrants | Uzbekistan | 0.6 /100 | #256 | Tragic 6.5% |
| Bermudans | 0.5 /100 | #257 | Tragic 6.5% |
| Spanish American Indians | 0.5 /100 | #258 | Tragic 6.5% |
| Aleuts | 0.4 /100 | #259 | Tragic 6.6% |
| Immigrants | Belize | 0.4 /100 | #260 | Tragic 6.6% |
| Irish | 0.4 /100 | #261 | Tragic 6.6% |