Immigrants from Nepal vs White/Caucasian Professional Degree
COMPARE
Immigrants from Nepal
White/Caucasian
Professional Degree
Professional Degree Comparison
Immigrants from Nepal
Whites/Caucasians
4.8%
PROFESSIONAL DEGREE
91.4/ 100
METRIC RATING
131st/ 347
METRIC RANK
4.1%
PROFESSIONAL DEGREE
11.2/ 100
METRIC RATING
212th/ 347
METRIC RANK
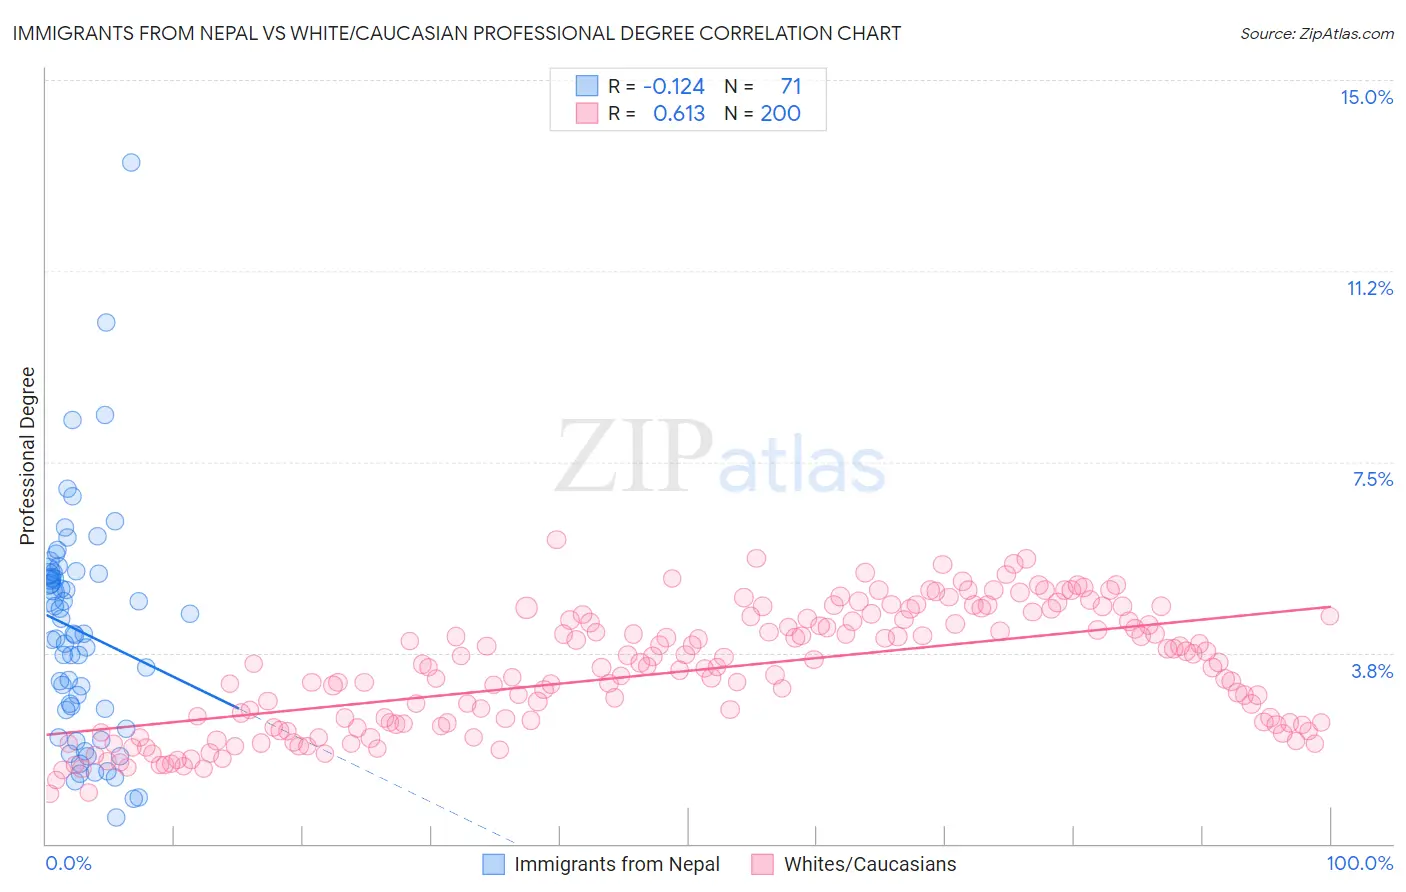
Immigrants from Nepal vs White/Caucasian Professional Degree Correlation Chart
The statistical analysis conducted on geographies consisting of 186,663,836 people shows a poor negative correlation between the proportion of Immigrants from Nepal and percentage of population with at least professional degree education in the United States with a correlation coefficient (R) of -0.124 and weighted average of 4.8%. Similarly, the statistical analysis conducted on geographies consisting of 572,420,788 people shows a significant positive correlation between the proportion of Whites/Caucasians and percentage of population with at least professional degree education in the United States with a correlation coefficient (R) of 0.613 and weighted average of 4.1%, a difference of 17.4%.
Professional Degree Correlation Summary
| Measurement | Immigrants from Nepal | White/Caucasian |
| Minimum | 0.52% | 0.97% |
| Maximum | 13.4% | 6.0% |
| Range | 12.9% | 5.0% |
| Mean | 4.2% | 3.4% |
| Median | 4.1% | 3.5% |
| Interquartile 25% (IQ1) | 2.6% | 2.3% |
| Interquartile 75% (IQ3) | 5.3% | 4.4% |
| Interquartile Range (IQR) | 2.7% | 2.0% |
| Standard Deviation (Sample) | 2.2% | 1.2% |
| Standard Deviation (Population) | 2.2% | 1.2% |
Similar Demographics by Professional Degree
Demographics Similar to Immigrants from Nepal by Professional Degree
In terms of professional degree, the demographic groups most similar to Immigrants from Nepal are Icelander (4.8%, a difference of 0.030%), Palestinian (4.8%, a difference of 0.050%), Pakistani (4.8%, a difference of 0.22%), Italian (4.8%, a difference of 0.48%), and Immigrants from Eastern Africa (4.8%, a difference of 0.51%).
| Demographics | Rating | Rank | Professional Degree |
| Immigrants | Eritrea | 93.5 /100 | #124 | Exceptional 4.8% |
| Immigrants | Albania | 93.3 /100 | #125 | Exceptional 4.8% |
| Europeans | 93.2 /100 | #126 | Exceptional 4.8% |
| Serbians | 92.6 /100 | #127 | Exceptional 4.8% |
| Immigrants | Eastern Africa | 92.5 /100 | #128 | Exceptional 4.8% |
| Palestinians | 91.5 /100 | #129 | Exceptional 4.8% |
| Icelanders | 91.5 /100 | #130 | Exceptional 4.8% |
| Immigrants | Nepal | 91.4 /100 | #131 | Exceptional 4.8% |
| Pakistanis | 90.9 /100 | #132 | Exceptional 4.8% |
| Italians | 90.2 /100 | #133 | Exceptional 4.8% |
| South American Indians | 89.9 /100 | #134 | Excellent 4.8% |
| Macedonians | 89.8 /100 | #135 | Excellent 4.8% |
| Immigrants | Jordan | 89.0 /100 | #136 | Excellent 4.7% |
| Jordanians | 88.9 /100 | #137 | Excellent 4.7% |
| Afghans | 88.8 /100 | #138 | Excellent 4.7% |
Demographics Similar to Whites/Caucasians by Professional Degree
In terms of professional degree, the demographic groups most similar to Whites/Caucasians are German (4.1%, a difference of 0.18%), Korean (4.1%, a difference of 0.18%), Immigrants from Nigeria (4.1%, a difference of 0.21%), Immigrants from Ghana (4.1%, a difference of 0.23%), and Portuguese (4.1%, a difference of 0.28%).
| Demographics | Rating | Rank | Professional Degree |
| Somalis | 14.8 /100 | #205 | Poor 4.1% |
| Yugoslavians | 13.4 /100 | #206 | Poor 4.1% |
| Sub-Saharan Africans | 12.8 /100 | #207 | Poor 4.1% |
| Immigrants | Somalia | 12.5 /100 | #208 | Poor 4.1% |
| Immigrants | Panama | 12.3 /100 | #209 | Poor 4.1% |
| Immigrants | Nigeria | 11.7 /100 | #210 | Poor 4.1% |
| Germans | 11.6 /100 | #211 | Poor 4.1% |
| Whites/Caucasians | 11.2 /100 | #212 | Poor 4.1% |
| Koreans | 10.7 /100 | #213 | Poor 4.1% |
| Immigrants | Ghana | 10.6 /100 | #214 | Poor 4.1% |
| Portuguese | 10.5 /100 | #215 | Poor 4.1% |
| West Indians | 9.8 /100 | #216 | Tragic 4.1% |
| Immigrants | Vietnam | 9.4 /100 | #217 | Tragic 4.0% |
| Dutch | 9.0 /100 | #218 | Tragic 4.0% |
| Immigrants | South Eastern Asia | 8.9 /100 | #219 | Tragic 4.0% |