Immigrants from Nepal vs Immigrants from Indonesia Disability Age 5 to 17
COMPARE
Immigrants from Nepal
Immigrants from Indonesia
Disability Age 5 to 17
Disability Age 5 to 17 Comparison
Immigrants from Nepal
Immigrants from Indonesia
5.5%
DISABILITY AGE 5 TO 17
77.1/ 100
METRIC RATING
158th/ 347
METRIC RANK
5.0%
DISABILITY AGE 5 TO 17
100.0/ 100
METRIC RATING
33rd/ 347
METRIC RANK
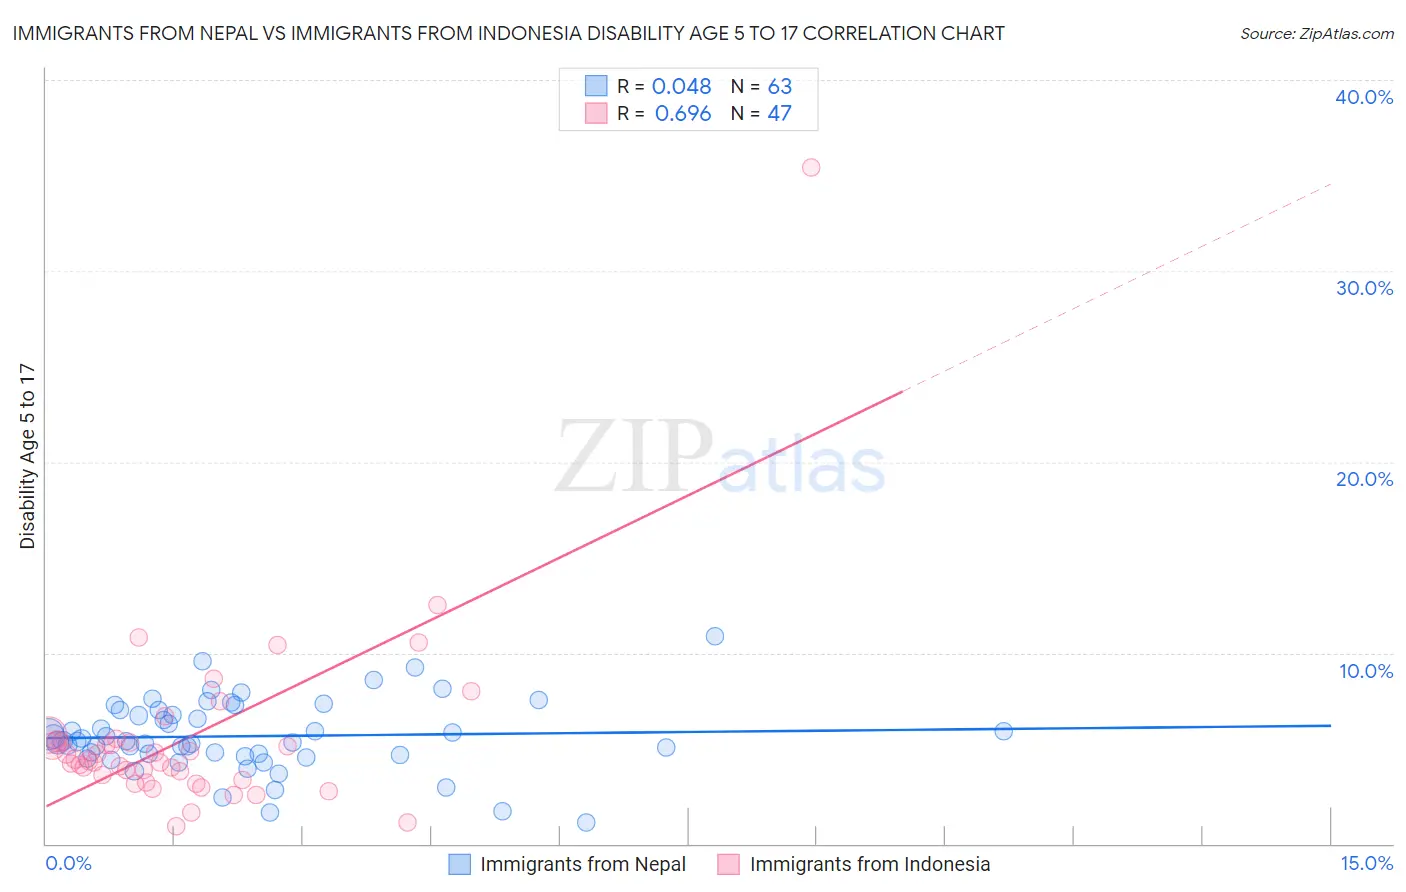
Immigrants from Nepal vs Immigrants from Indonesia Disability Age 5 to 17 Correlation Chart
The statistical analysis conducted on geographies consisting of 186,213,470 people shows no correlation between the proportion of Immigrants from Nepal and percentage of population with a disability between the ages 5 and 17 in the United States with a correlation coefficient (R) of 0.048 and weighted average of 5.5%. Similarly, the statistical analysis conducted on geographies consisting of 214,816,459 people shows a significant positive correlation between the proportion of Immigrants from Indonesia and percentage of population with a disability between the ages 5 and 17 in the United States with a correlation coefficient (R) of 0.696 and weighted average of 5.0%, a difference of 10.6%.
Disability Age 5 to 17 Correlation Summary
| Measurement | Immigrants from Nepal | Immigrants from Indonesia |
| Minimum | 1.1% | 0.90% |
| Maximum | 10.9% | 35.4% |
| Range | 9.7% | 34.5% |
| Mean | 5.6% | 5.5% |
| Median | 5.4% | 4.4% |
| Interquartile 25% (IQ1) | 4.6% | 3.3% |
| Interquartile 75% (IQ3) | 7.0% | 5.4% |
| Interquartile Range (IQR) | 2.4% | 2.0% |
| Standard Deviation (Sample) | 1.9% | 5.1% |
| Standard Deviation (Population) | 1.9% | 5.0% |
Similar Demographics by Disability Age 5 to 17
Demographics Similar to Immigrants from Nepal by Disability Age 5 to 17
In terms of disability age 5 to 17, the demographic groups most similar to Immigrants from Nepal are Immigrants from Costa Rica (5.5%, a difference of 0.050%), Hawaiian (5.5%, a difference of 0.060%), Immigrants from Ecuador (5.5%, a difference of 0.080%), Australian (5.5%, a difference of 0.12%), and Immigrants from Zimbabwe (5.5%, a difference of 0.13%).
| Demographics | Rating | Rank | Disability Age 5 to 17 |
| Estonians | 80.8 /100 | #151 | Excellent 5.5% |
| Ute | 80.6 /100 | #152 | Excellent 5.5% |
| Ecuadorians | 79.7 /100 | #153 | Good 5.5% |
| Australians | 78.8 /100 | #154 | Good 5.5% |
| Immigrants | Ecuador | 78.3 /100 | #155 | Good 5.5% |
| Hawaiians | 78.0 /100 | #156 | Good 5.5% |
| Immigrants | Costa Rica | 77.9 /100 | #157 | Good 5.5% |
| Immigrants | Nepal | 77.1 /100 | #158 | Good 5.5% |
| Immigrants | Zimbabwe | 75.3 /100 | #159 | Good 5.5% |
| South Africans | 73.3 /100 | #160 | Good 5.5% |
| Immigrants | Saudi Arabia | 69.1 /100 | #161 | Good 5.5% |
| Zimbabweans | 67.2 /100 | #162 | Good 5.5% |
| Immigrants | Southern Europe | 64.0 /100 | #163 | Good 5.6% |
| Immigrants | Scotland | 61.9 /100 | #164 | Good 5.6% |
| Lebanese | 61.4 /100 | #165 | Good 5.6% |
Demographics Similar to Immigrants from Indonesia by Disability Age 5 to 17
In terms of disability age 5 to 17, the demographic groups most similar to Immigrants from Indonesia are Israeli (5.0%, a difference of 0.12%), Bolivian (5.0%, a difference of 0.30%), Soviet Union (5.0%, a difference of 0.32%), Immigrants from Egypt (5.0%, a difference of 0.35%), and Immigrants from Pakistan (5.0%, a difference of 0.36%).
| Demographics | Rating | Rank | Disability Age 5 to 17 |
| Bhutanese | 100.0 /100 | #26 | Exceptional 4.9% |
| Taiwanese | 100.0 /100 | #27 | Exceptional 4.9% |
| Immigrants | Japan | 100.0 /100 | #28 | Exceptional 4.9% |
| Immigrants | Serbia | 100.0 /100 | #29 | Exceptional 4.9% |
| Immigrants | Malaysia | 100.0 /100 | #30 | Exceptional 5.0% |
| Immigrants | Pakistan | 100.0 /100 | #31 | Exceptional 5.0% |
| Soviet Union | 100.0 /100 | #32 | Exceptional 5.0% |
| Immigrants | Indonesia | 100.0 /100 | #33 | Exceptional 5.0% |
| Israelis | 100.0 /100 | #34 | Exceptional 5.0% |
| Bolivians | 100.0 /100 | #35 | Exceptional 5.0% |
| Immigrants | Egypt | 100.0 /100 | #36 | Exceptional 5.0% |
| Immigrants | Belarus | 100.0 /100 | #37 | Exceptional 5.0% |
| Immigrants | Philippines | 100.0 /100 | #38 | Exceptional 5.0% |
| Immigrants | Argentina | 100.0 /100 | #39 | Exceptional 5.0% |
| Okinawans | 100.0 /100 | #40 | Exceptional 5.0% |