Immigrants from Hong Kong vs Immigrants from Japan Self-Care Disability
COMPARE
Immigrants from Hong Kong
Immigrants from Japan
Self-Care Disability
Self-Care Disability Comparison
Immigrants from Hong Kong
Immigrants from Japan
2.4%
SELF-CARE DISABILITY
93.1/ 100
METRIC RATING
115th/ 347
METRIC RANK
2.3%
SELF-CARE DISABILITY
99.5/ 100
METRIC RATING
60th/ 347
METRIC RANK
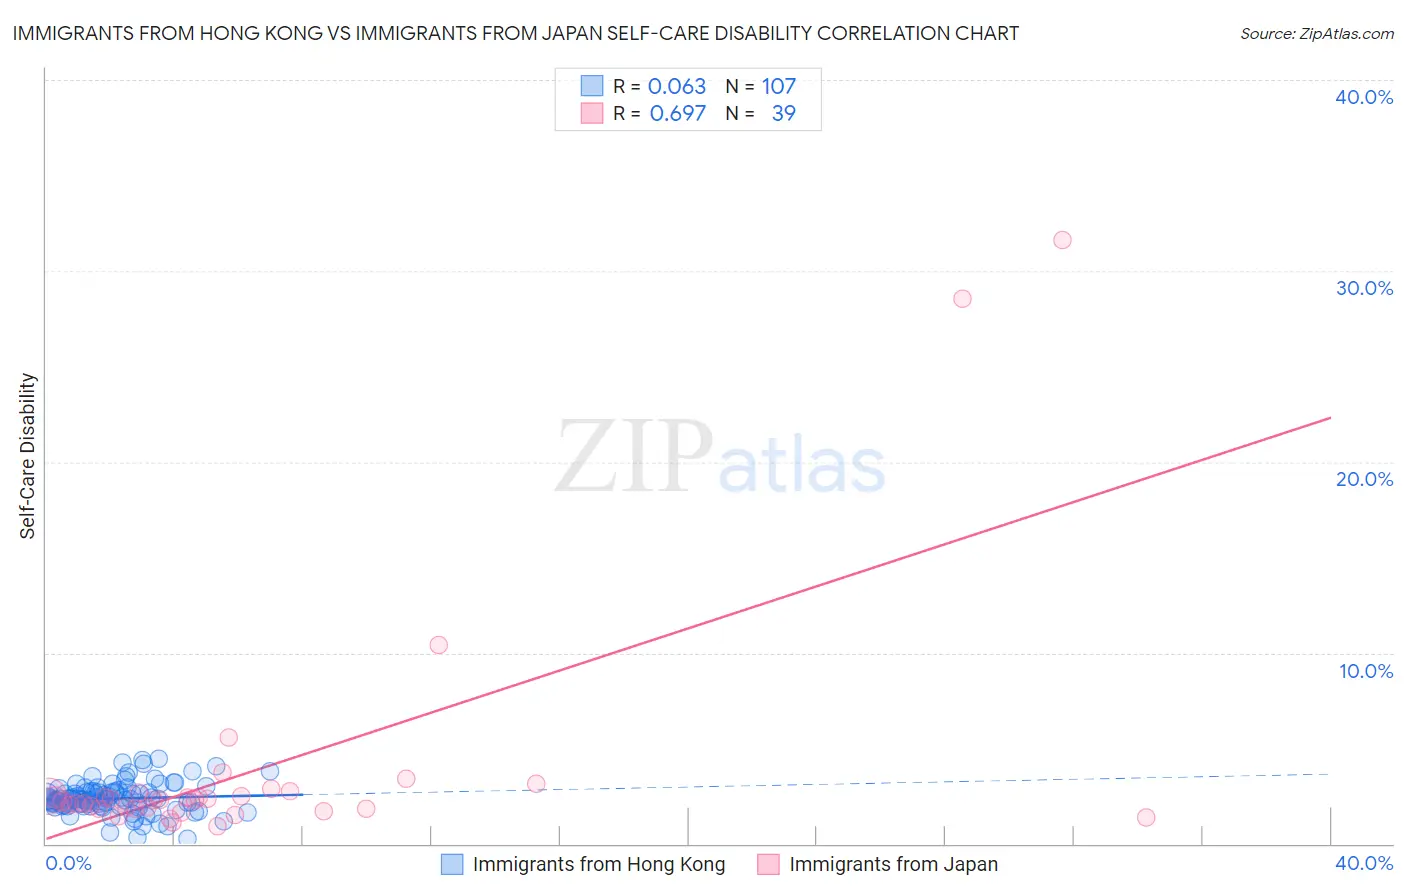
Immigrants from Hong Kong vs Immigrants from Japan Self-Care Disability Correlation Chart
The statistical analysis conducted on geographies consisting of 253,791,593 people shows a slight positive correlation between the proportion of Immigrants from Hong Kong and percentage of population with self-care disability in the United States with a correlation coefficient (R) of 0.063 and weighted average of 2.4%. Similarly, the statistical analysis conducted on geographies consisting of 339,768,160 people shows a significant positive correlation between the proportion of Immigrants from Japan and percentage of population with self-care disability in the United States with a correlation coefficient (R) of 0.697 and weighted average of 2.3%, a difference of 3.3%.
Self-Care Disability Correlation Summary
| Measurement | Immigrants from Hong Kong | Immigrants from Japan |
| Minimum | 0.25% | 0.90% |
| Maximum | 4.4% | 31.6% |
| Range | 4.2% | 30.7% |
| Mean | 2.4% | 3.9% |
| Median | 2.3% | 2.3% |
| Interquartile 25% (IQ1) | 2.0% | 1.8% |
| Interquartile 75% (IQ3) | 2.7% | 2.7% |
| Interquartile Range (IQR) | 0.75% | 0.86% |
| Standard Deviation (Sample) | 0.79% | 6.4% |
| Standard Deviation (Population) | 0.78% | 6.3% |
Similar Demographics by Self-Care Disability
Demographics Similar to Immigrants from Hong Kong by Self-Care Disability
In terms of self-care disability, the demographic groups most similar to Immigrants from Hong Kong are Immigrants from North Macedonia (2.4%, a difference of 0.0%), South American (2.4%, a difference of 0.010%), Northern European (2.4%, a difference of 0.050%), Scandinavian (2.4%, a difference of 0.070%), and Serbian (2.4%, a difference of 0.090%).
| Demographics | Rating | Rank | Self-Care Disability |
| Greeks | 94.1 /100 | #108 | Exceptional 2.4% |
| Slovenes | 94.1 /100 | #109 | Exceptional 2.4% |
| Immigrants | Africa | 93.7 /100 | #110 | Exceptional 2.4% |
| Serbians | 93.6 /100 | #111 | Exceptional 2.4% |
| Scandinavians | 93.5 /100 | #112 | Exceptional 2.4% |
| South Americans | 93.2 /100 | #113 | Exceptional 2.4% |
| Immigrants | North Macedonia | 93.1 /100 | #114 | Exceptional 2.4% |
| Immigrants | Hong Kong | 93.1 /100 | #115 | Exceptional 2.4% |
| Northern Europeans | 92.9 /100 | #116 | Exceptional 2.4% |
| Taiwanese | 92.5 /100 | #117 | Exceptional 2.4% |
| Immigrants | Canada | 92.0 /100 | #118 | Exceptional 2.4% |
| Immigrants | Sierra Leone | 91.8 /100 | #119 | Exceptional 2.4% |
| Uruguayans | 91.5 /100 | #120 | Exceptional 2.4% |
| Peruvians | 91.3 /100 | #121 | Exceptional 2.4% |
| Belgians | 90.9 /100 | #122 | Exceptional 2.4% |
Demographics Similar to Immigrants from Japan by Self-Care Disability
In terms of self-care disability, the demographic groups most similar to Immigrants from Japan are Palestinian (2.3%, a difference of 0.10%), New Zealander (2.3%, a difference of 0.14%), Egyptian (2.3%, a difference of 0.19%), Immigrants from Cameroon (2.3%, a difference of 0.25%), and Mongolian (2.3%, a difference of 0.27%).
| Demographics | Rating | Rank | Self-Care Disability |
| Australians | 99.6 /100 | #53 | Exceptional 2.3% |
| Argentineans | 99.6 /100 | #54 | Exceptional 2.3% |
| Immigrants | France | 99.6 /100 | #55 | Exceptional 2.3% |
| Immigrants | Eastern Asia | 99.6 /100 | #56 | Exceptional 2.3% |
| Immigrants | Belgium | 99.6 /100 | #57 | Exceptional 2.3% |
| Immigrants | Cameroon | 99.6 /100 | #58 | Exceptional 2.3% |
| New Zealanders | 99.5 /100 | #59 | Exceptional 2.3% |
| Immigrants | Japan | 99.5 /100 | #60 | Exceptional 2.3% |
| Palestinians | 99.4 /100 | #61 | Exceptional 2.3% |
| Egyptians | 99.4 /100 | #62 | Exceptional 2.3% |
| Mongolians | 99.3 /100 | #63 | Exceptional 2.3% |
| Swedes | 99.3 /100 | #64 | Exceptional 2.3% |
| Brazilians | 99.3 /100 | #65 | Exceptional 2.3% |
| Immigrants | Argentina | 99.3 /100 | #66 | Exceptional 2.3% |
| South Africans | 99.3 /100 | #67 | Exceptional 2.3% |