Immigrants from Bulgaria vs Immigrants from Japan Self-Care Disability
COMPARE
Immigrants from Bulgaria
Immigrants from Japan
Self-Care Disability
Self-Care Disability Comparison
Immigrants from Bulgaria
Immigrants from Japan
2.3%
SELF-CARE DISABILITY
99.8/ 100
METRIC RATING
39th/ 347
METRIC RANK
2.3%
SELF-CARE DISABILITY
99.5/ 100
METRIC RATING
60th/ 347
METRIC RANK
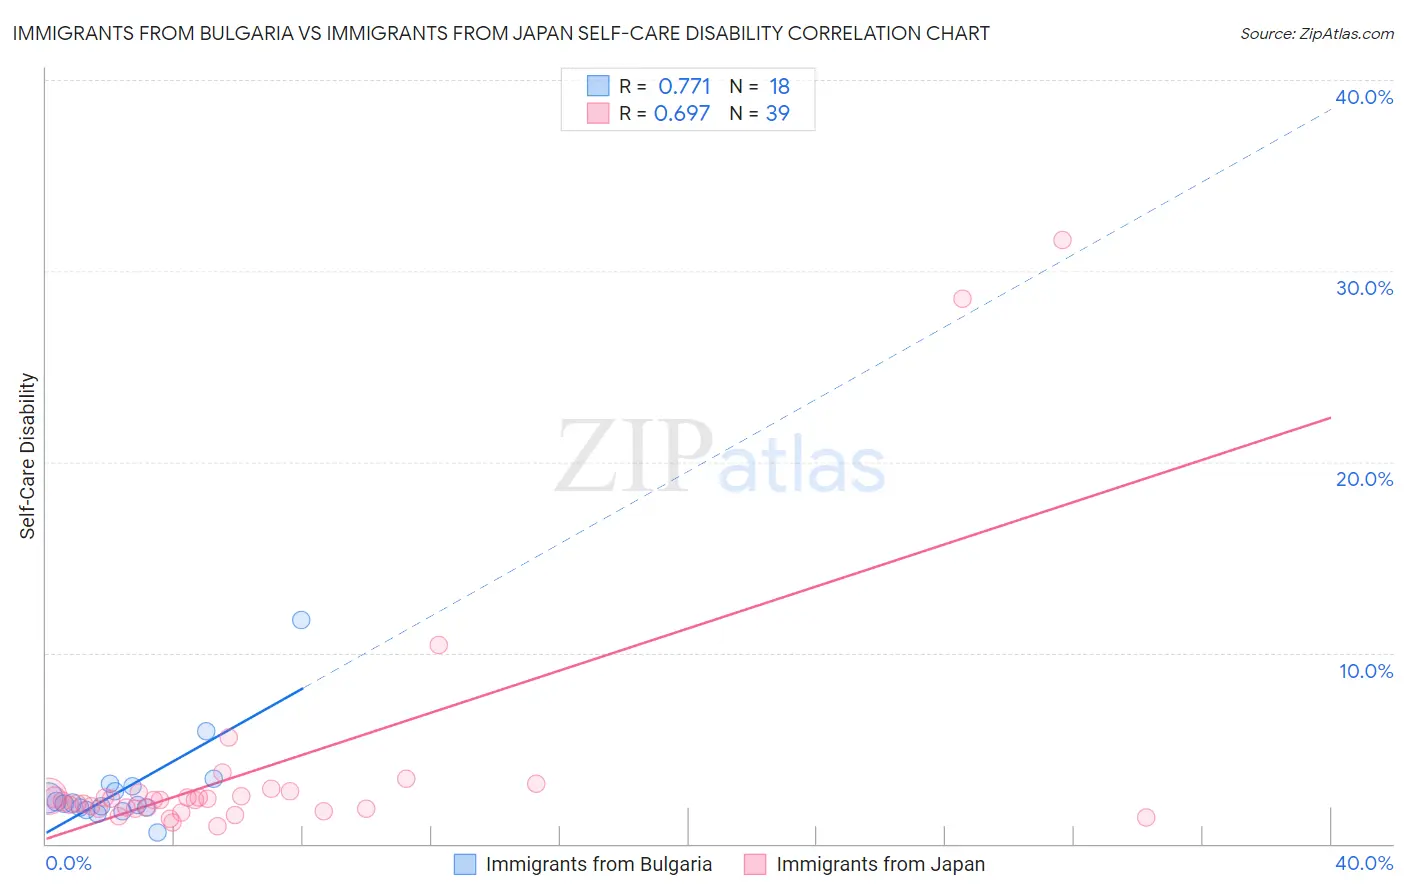
Immigrants from Bulgaria vs Immigrants from Japan Self-Care Disability Correlation Chart
The statistical analysis conducted on geographies consisting of 172,509,254 people shows a strong positive correlation between the proportion of Immigrants from Bulgaria and percentage of population with self-care disability in the United States with a correlation coefficient (R) of 0.771 and weighted average of 2.3%. Similarly, the statistical analysis conducted on geographies consisting of 339,768,160 people shows a significant positive correlation between the proportion of Immigrants from Japan and percentage of population with self-care disability in the United States with a correlation coefficient (R) of 0.697 and weighted average of 2.3%, a difference of 1.6%.
Self-Care Disability Correlation Summary
| Measurement | Immigrants from Bulgaria | Immigrants from Japan |
| Minimum | 0.60% | 0.90% |
| Maximum | 11.7% | 31.6% |
| Range | 11.1% | 30.7% |
| Mean | 2.9% | 3.9% |
| Median | 2.1% | 2.3% |
| Interquartile 25% (IQ1) | 1.9% | 1.8% |
| Interquartile 75% (IQ3) | 3.0% | 2.7% |
| Interquartile Range (IQR) | 1.1% | 0.86% |
| Standard Deviation (Sample) | 2.4% | 6.4% |
| Standard Deviation (Population) | 2.4% | 6.3% |
Similar Demographics by Self-Care Disability
Demographics Similar to Immigrants from Bulgaria by Self-Care Disability
In terms of self-care disability, the demographic groups most similar to Immigrants from Bulgaria are Iranian (2.3%, a difference of 0.040%), Immigrants from Eastern Africa (2.3%, a difference of 0.10%), Immigrants from Sudan (2.3%, a difference of 0.11%), Immigrants from Uganda (2.3%, a difference of 0.21%), and Immigrants from Sweden (2.3%, a difference of 0.23%).
| Demographics | Rating | Rank | Self-Care Disability |
| Burmese | 99.9 /100 | #32 | Exceptional 2.3% |
| Immigrants | Korea | 99.9 /100 | #33 | Exceptional 2.3% |
| Immigrants | Turkey | 99.9 /100 | #34 | Exceptional 2.3% |
| Immigrants | Australia | 99.9 /100 | #35 | Exceptional 2.3% |
| Immigrants | Lithuania | 99.9 /100 | #36 | Exceptional 2.3% |
| Immigrants | Sweden | 99.9 /100 | #37 | Exceptional 2.3% |
| Immigrants | Eastern Africa | 99.9 /100 | #38 | Exceptional 2.3% |
| Immigrants | Bulgaria | 99.8 /100 | #39 | Exceptional 2.3% |
| Iranians | 99.8 /100 | #40 | Exceptional 2.3% |
| Immigrants | Sudan | 99.8 /100 | #41 | Exceptional 2.3% |
| Immigrants | Uganda | 99.8 /100 | #42 | Exceptional 2.3% |
| Immigrants | Pakistan | 99.8 /100 | #43 | Exceptional 2.3% |
| Immigrants | South Africa | 99.8 /100 | #44 | Exceptional 2.3% |
| Norwegians | 99.8 /100 | #45 | Exceptional 2.3% |
| Czechs | 99.8 /100 | #46 | Exceptional 2.3% |
Demographics Similar to Immigrants from Japan by Self-Care Disability
In terms of self-care disability, the demographic groups most similar to Immigrants from Japan are Palestinian (2.3%, a difference of 0.10%), New Zealander (2.3%, a difference of 0.14%), Egyptian (2.3%, a difference of 0.19%), Immigrants from Cameroon (2.3%, a difference of 0.25%), and Mongolian (2.3%, a difference of 0.27%).
| Demographics | Rating | Rank | Self-Care Disability |
| Australians | 99.6 /100 | #53 | Exceptional 2.3% |
| Argentineans | 99.6 /100 | #54 | Exceptional 2.3% |
| Immigrants | France | 99.6 /100 | #55 | Exceptional 2.3% |
| Immigrants | Eastern Asia | 99.6 /100 | #56 | Exceptional 2.3% |
| Immigrants | Belgium | 99.6 /100 | #57 | Exceptional 2.3% |
| Immigrants | Cameroon | 99.6 /100 | #58 | Exceptional 2.3% |
| New Zealanders | 99.5 /100 | #59 | Exceptional 2.3% |
| Immigrants | Japan | 99.5 /100 | #60 | Exceptional 2.3% |
| Palestinians | 99.4 /100 | #61 | Exceptional 2.3% |
| Egyptians | 99.4 /100 | #62 | Exceptional 2.3% |
| Mongolians | 99.3 /100 | #63 | Exceptional 2.3% |
| Swedes | 99.3 /100 | #64 | Exceptional 2.3% |
| Brazilians | 99.3 /100 | #65 | Exceptional 2.3% |
| Immigrants | Argentina | 99.3 /100 | #66 | Exceptional 2.3% |
| South Africans | 99.3 /100 | #67 | Exceptional 2.3% |