Serbian vs Japanese Male Disability
COMPARE
Serbian
Japanese
Male Disability
Male Disability Comparison
Serbians
Japanese
11.5%
MALE DISABILITY
10.7/ 100
METRIC RATING
205th/ 347
METRIC RANK
11.7%
MALE DISABILITY
3.1/ 100
METRIC RATING
224th/ 347
METRIC RANK
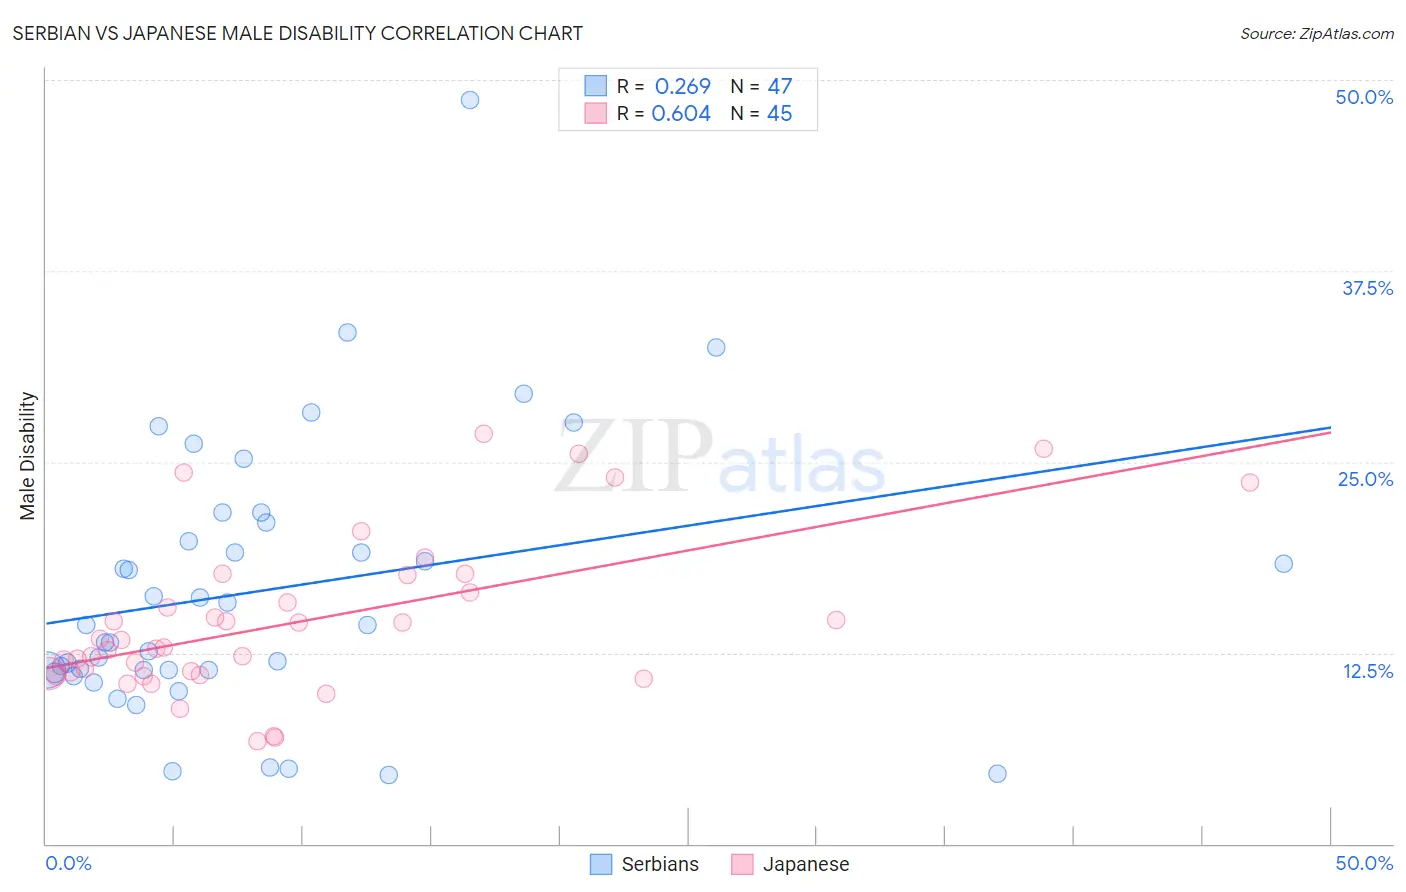
Serbian vs Japanese Male Disability Correlation Chart
The statistical analysis conducted on geographies consisting of 267,640,230 people shows a weak positive correlation between the proportion of Serbians and percentage of males with a disability in the United States with a correlation coefficient (R) of 0.269 and weighted average of 11.5%. Similarly, the statistical analysis conducted on geographies consisting of 249,159,975 people shows a significant positive correlation between the proportion of Japanese and percentage of males with a disability in the United States with a correlation coefficient (R) of 0.604 and weighted average of 11.7%, a difference of 1.8%.
Male Disability Correlation Summary
| Measurement | Serbian | Japanese |
| Minimum | 4.5% | 6.7% |
| Maximum | 48.7% | 26.9% |
| Range | 44.3% | 20.2% |
| Mean | 16.6% | 14.5% |
| Median | 14.3% | 12.9% |
| Interquartile 25% (IQ1) | 11.3% | 11.1% |
| Interquartile 75% (IQ3) | 21.0% | 17.0% |
| Interquartile Range (IQR) | 9.7% | 5.9% |
| Standard Deviation (Sample) | 8.8% | 5.1% |
| Standard Deviation (Population) | 8.8% | 5.1% |
Demographics Similar to Serbians and Japanese by Male Disability
In terms of male disability, the demographic groups most similar to Serbians are Immigrants from Cambodia (11.5%, a difference of 0.0%), Ukrainian (11.5%, a difference of 0.010%), Immigrants from Somalia (11.5%, a difference of 0.040%), Icelander (11.6%, a difference of 0.080%), and Spanish American Indian (11.6%, a difference of 0.090%). Similarly, the demographic groups most similar to Japanese are Immigrants from Bahamas (11.7%, a difference of 0.020%), Alsatian (11.7%, a difference of 0.11%), Immigrants from Congo (11.7%, a difference of 0.26%), Immigrants from Western Europe (11.7%, a difference of 0.27%), and Panamanian (11.7%, a difference of 0.28%).
| Demographics | Rating | Rank | Male Disability |
| Immigrants | Cambodia | 10.8 /100 | #204 | Poor 11.5% |
| Serbians | 10.7 /100 | #205 | Poor 11.5% |
| Ukrainians | 10.6 /100 | #206 | Poor 11.5% |
| Immigrants | Somalia | 10.4 /100 | #207 | Poor 11.5% |
| Icelanders | 10.1 /100 | #208 | Poor 11.6% |
| Spanish American Indians | 10.1 /100 | #209 | Poor 11.6% |
| Ute | 9.4 /100 | #210 | Tragic 11.6% |
| Immigrants | Thailand | 8.4 /100 | #211 | Tragic 11.6% |
| Immigrants | Scotland | 8.2 /100 | #212 | Tragic 11.6% |
| Mexican American Indians | 7.8 /100 | #213 | Tragic 11.6% |
| Lithuanians | 6.6 /100 | #214 | Tragic 11.6% |
| Indonesians | 5.9 /100 | #215 | Tragic 11.6% |
| Immigrants | Dominican Republic | 4.9 /100 | #216 | Tragic 11.7% |
| Immigrants | Dominica | 4.6 /100 | #217 | Tragic 11.7% |
| Immigrants | England | 4.0 /100 | #218 | Tragic 11.7% |
| Panamanians | 3.8 /100 | #219 | Tragic 11.7% |
| Immigrants | Western Europe | 3.8 /100 | #220 | Tragic 11.7% |
| Immigrants | Congo | 3.7 /100 | #221 | Tragic 11.7% |
| Alsatians | 3.3 /100 | #222 | Tragic 11.7% |
| Immigrants | Bahamas | 3.2 /100 | #223 | Tragic 11.7% |
| Japanese | 3.1 /100 | #224 | Tragic 11.7% |