Immigrants from Indonesia vs Belizean Disability
COMPARE
Immigrants from Indonesia
Belizean
Disability
Disability Comparison
Immigrants from Indonesia
Belizeans
10.7%
DISABILITY
100.0/ 100
METRIC RATING
35th/ 347
METRIC RANK
11.9%
DISABILITY
12.8/ 100
METRIC RATING
200th/ 347
METRIC RANK
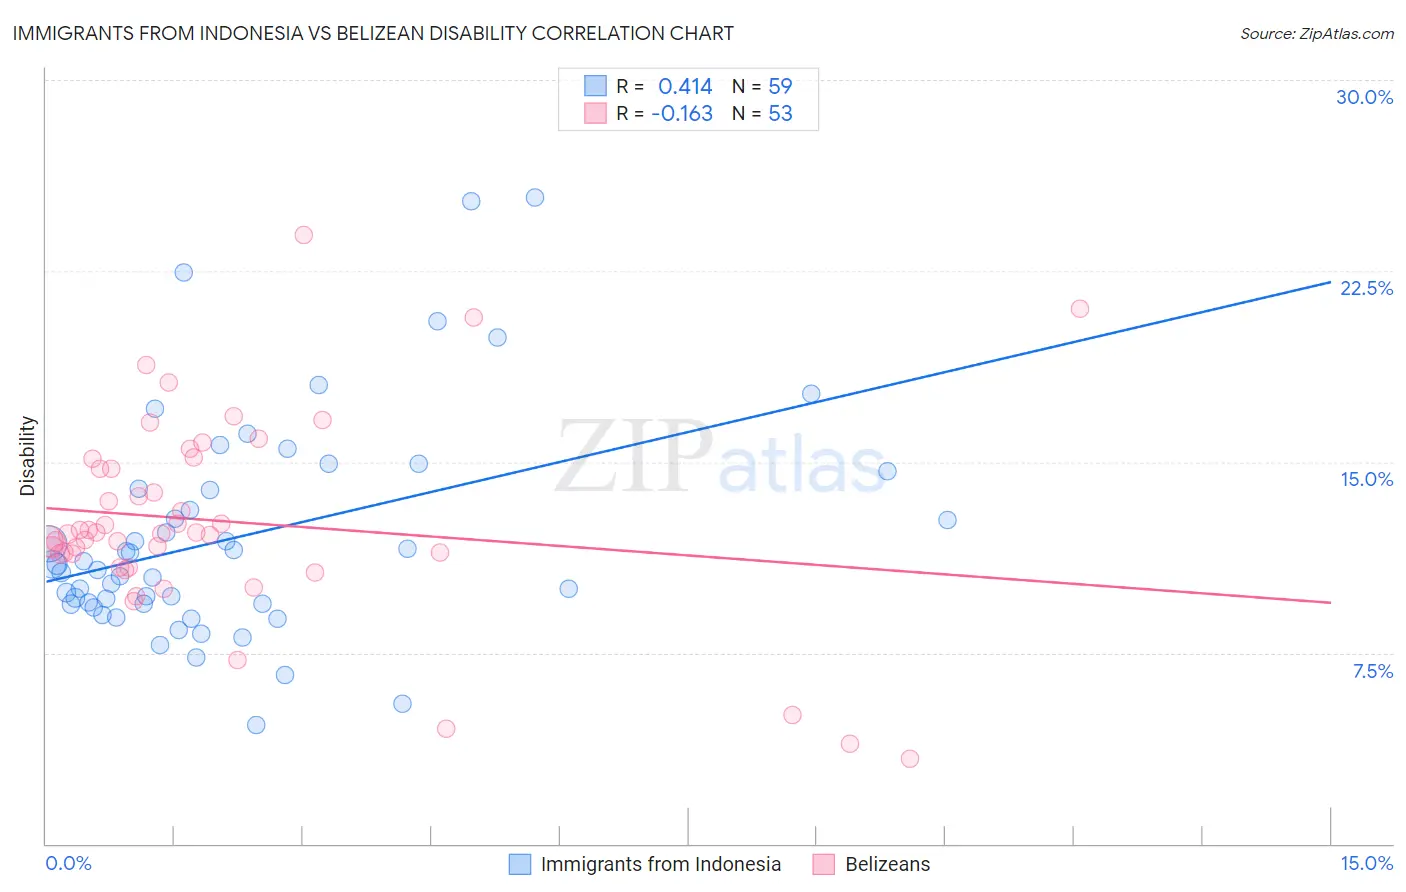
Immigrants from Indonesia vs Belizean Disability Correlation Chart
The statistical analysis conducted on geographies consisting of 215,790,379 people shows a moderate positive correlation between the proportion of Immigrants from Indonesia and percentage of population with a disability in the United States with a correlation coefficient (R) of 0.414 and weighted average of 10.7%. Similarly, the statistical analysis conducted on geographies consisting of 144,197,719 people shows a poor negative correlation between the proportion of Belizeans and percentage of population with a disability in the United States with a correlation coefficient (R) of -0.163 and weighted average of 11.9%, a difference of 11.7%.
Disability Correlation Summary
| Measurement | Immigrants from Indonesia | Belizean |
| Minimum | 4.7% | 3.4% |
| Maximum | 25.4% | 23.9% |
| Range | 20.7% | 20.5% |
| Mean | 12.1% | 12.7% |
| Median | 11.0% | 12.2% |
| Interquartile 25% (IQ1) | 9.4% | 11.1% |
| Interquartile 75% (IQ3) | 14.0% | 14.9% |
| Interquartile Range (IQR) | 4.5% | 3.8% |
| Standard Deviation (Sample) | 4.3% | 3.9% |
| Standard Deviation (Population) | 4.3% | 3.9% |
Similar Demographics by Disability
Demographics Similar to Immigrants from Indonesia by Disability
In terms of disability, the demographic groups most similar to Immigrants from Indonesia are Immigrants from Ethiopia (10.7%, a difference of 0.010%), Ethiopian (10.7%, a difference of 0.060%), Turkish (10.7%, a difference of 0.070%), Immigrants from Kuwait (10.7%, a difference of 0.23%), and Paraguayan (10.6%, a difference of 0.48%).
| Demographics | Rating | Rank | Disability |
| Egyptians | 100.0 /100 | #28 | Exceptional 10.6% |
| Immigrants | Argentina | 100.0 /100 | #29 | Exceptional 10.6% |
| Immigrants | Turkey | 100.0 /100 | #30 | Exceptional 10.6% |
| Immigrants | Egypt | 100.0 /100 | #31 | Exceptional 10.6% |
| Paraguayans | 100.0 /100 | #32 | Exceptional 10.6% |
| Immigrants | Kuwait | 100.0 /100 | #33 | Exceptional 10.7% |
| Immigrants | Ethiopia | 100.0 /100 | #34 | Exceptional 10.7% |
| Immigrants | Indonesia | 100.0 /100 | #35 | Exceptional 10.7% |
| Ethiopians | 100.0 /100 | #36 | Exceptional 10.7% |
| Turks | 100.0 /100 | #37 | Exceptional 10.7% |
| Afghans | 99.9 /100 | #38 | Exceptional 10.8% |
| Cambodians | 99.9 /100 | #39 | Exceptional 10.8% |
| Mongolians | 99.9 /100 | #40 | Exceptional 10.8% |
| Immigrants | Australia | 99.9 /100 | #41 | Exceptional 10.8% |
| Immigrants | Nepal | 99.9 /100 | #42 | Exceptional 10.8% |
Demographics Similar to Belizeans by Disability
In terms of disability, the demographic groups most similar to Belizeans are Assyrian/Chaldean/Syriac (11.9%, a difference of 0.020%), Immigrants from England (12.0%, a difference of 0.090%), British West Indian (12.0%, a difference of 0.14%), Mexican American Indian (12.0%, a difference of 0.14%), and Immigrants from Panama (11.9%, a difference of 0.16%).
| Demographics | Rating | Rank | Disability |
| Immigrants | Bosnia and Herzegovina | 18.0 /100 | #193 | Poor 11.9% |
| Somalis | 17.3 /100 | #194 | Poor 11.9% |
| Barbadians | 15.8 /100 | #195 | Poor 11.9% |
| Serbians | 15.4 /100 | #196 | Poor 11.9% |
| Immigrants | Belize | 15.2 /100 | #197 | Poor 11.9% |
| Ukrainians | 14.7 /100 | #198 | Poor 11.9% |
| Immigrants | Panama | 14.6 /100 | #199 | Poor 11.9% |
| Belizeans | 12.8 /100 | #200 | Poor 11.9% |
| Assyrians/Chaldeans/Syriacs | 12.6 /100 | #201 | Poor 11.9% |
| Immigrants | England | 12.0 /100 | #202 | Poor 12.0% |
| British West Indians | 11.5 /100 | #203 | Poor 12.0% |
| Mexican American Indians | 11.4 /100 | #204 | Poor 12.0% |
| Immigrants | Western Europe | 10.1 /100 | #205 | Poor 12.0% |
| Immigrants | Senegal | 9.4 /100 | #206 | Tragic 12.0% |
| Immigrants | Thailand | 9.3 /100 | #207 | Tragic 12.0% |