Immigrants from Micronesia vs Belizean 12th Grade, No Diploma
COMPARE
Immigrants from Micronesia
Belizean
12th Grade, No Diploma
12th Grade, No Diploma Comparison
Immigrants from Micronesia
Belizeans
90.6%
12TH GRADE, NO DIPLOMA
11.0/ 100
METRIC RATING
208th/ 347
METRIC RANK
87.0%
12TH GRADE, NO DIPLOMA
0.0/ 100
METRIC RATING
318th/ 347
METRIC RANK
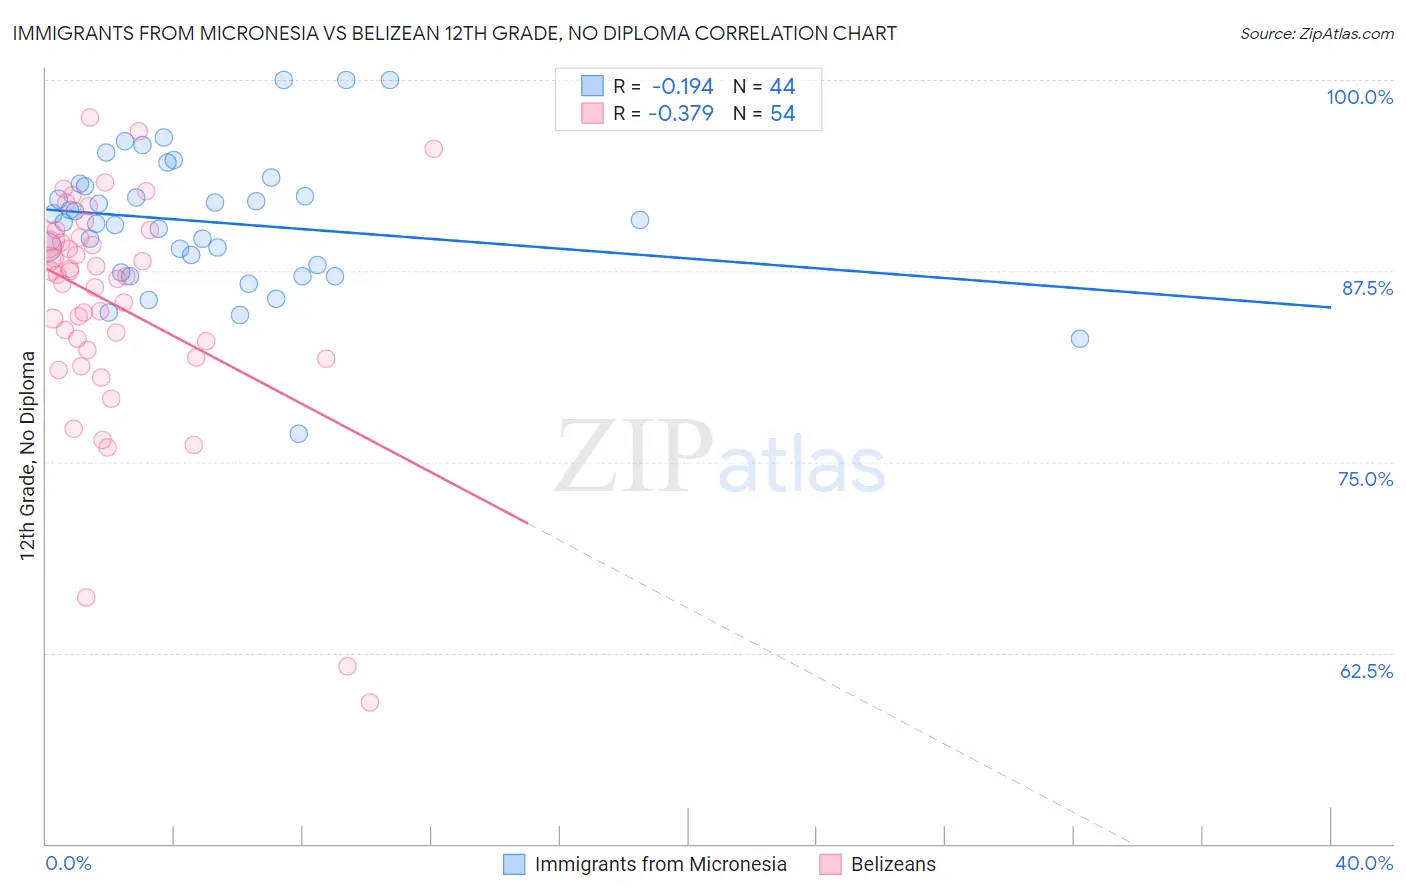
Immigrants from Micronesia vs Belizean 12th Grade, No Diploma Correlation Chart
The statistical analysis conducted on geographies consisting of 61,609,499 people shows a poor negative correlation between the proportion of Immigrants from Micronesia and percentage of population with at least 12th grade (no diploma) education in the United States with a correlation coefficient (R) of -0.194 and weighted average of 90.6%. Similarly, the statistical analysis conducted on geographies consisting of 144,225,006 people shows a mild negative correlation between the proportion of Belizeans and percentage of population with at least 12th grade (no diploma) education in the United States with a correlation coefficient (R) of -0.379 and weighted average of 87.0%, a difference of 4.1%.
12th Grade, No Diploma Correlation Summary
| Measurement | Immigrants from Micronesia | Belizean |
| Minimum | 76.9% | 59.3% |
| Maximum | 100.0% | 97.5% |
| Range | 23.1% | 38.2% |
| Mean | 90.7% | 85.3% |
| Median | 90.8% | 87.2% |
| Interquartile 25% (IQ1) | 87.7% | 82.3% |
| Interquartile 75% (IQ3) | 93.1% | 89.5% |
| Interquartile Range (IQR) | 5.5% | 7.2% |
| Standard Deviation (Sample) | 4.6% | 7.5% |
| Standard Deviation (Population) | 4.5% | 7.5% |
Similar Demographics by 12th Grade, No Diploma
Demographics Similar to Immigrants from Micronesia by 12th Grade, No Diploma
In terms of 12th grade, no diploma, the demographic groups most similar to Immigrants from Micronesia are Immigrants from Afghanistan (90.6%, a difference of 0.0%), South American Indian (90.6%, a difference of 0.0%), Portuguese (90.6%, a difference of 0.010%), Armenian (90.6%, a difference of 0.020%), and Somali (90.6%, a difference of 0.030%).
| Demographics | Rating | Rank | 12th Grade, No Diploma |
| Hawaiians | 19.7 /100 | #201 | Poor 90.8% |
| Marshallese | 18.2 /100 | #202 | Poor 90.7% |
| Tongans | 16.1 /100 | #203 | Poor 90.7% |
| French American Indians | 15.5 /100 | #204 | Poor 90.7% |
| Immigrants | Sierra Leone | 14.9 /100 | #205 | Poor 90.7% |
| Immigrants | Bolivia | 12.3 /100 | #206 | Poor 90.6% |
| Armenians | 11.6 /100 | #207 | Poor 90.6% |
| Immigrants | Micronesia | 11.0 /100 | #208 | Poor 90.6% |
| Immigrants | Afghanistan | 11.0 /100 | #209 | Poor 90.6% |
| South American Indians | 10.9 /100 | #210 | Poor 90.6% |
| Portuguese | 10.6 /100 | #211 | Poor 90.6% |
| Somalis | 10.2 /100 | #212 | Poor 90.6% |
| Costa Ricans | 9.4 /100 | #213 | Tragic 90.5% |
| Immigrants | Africa | 8.5 /100 | #214 | Tragic 90.5% |
| Arapaho | 7.7 /100 | #215 | Tragic 90.5% |
Demographics Similar to Belizeans by 12th Grade, No Diploma
In terms of 12th grade, no diploma, the demographic groups most similar to Belizeans are Navajo (87.1%, a difference of 0.060%), Immigrants from Belize (87.0%, a difference of 0.080%), Apache (87.3%, a difference of 0.35%), Nicaraguan (87.3%, a difference of 0.36%), and Cape Verdean (87.4%, a difference of 0.40%).
| Demographics | Rating | Rank | 12th Grade, No Diploma |
| Yaqui | 0.0 /100 | #311 | Tragic 87.5% |
| Immigrants | Ecuador | 0.0 /100 | #312 | Tragic 87.5% |
| Immigrants | Caribbean | 0.0 /100 | #313 | Tragic 87.4% |
| Cape Verdeans | 0.0 /100 | #314 | Tragic 87.4% |
| Nicaraguans | 0.0 /100 | #315 | Tragic 87.3% |
| Apache | 0.0 /100 | #316 | Tragic 87.3% |
| Navajo | 0.0 /100 | #317 | Tragic 87.1% |
| Belizeans | 0.0 /100 | #318 | Tragic 87.0% |
| Immigrants | Belize | 0.0 /100 | #319 | Tragic 87.0% |
| Immigrants | Nicaragua | 0.0 /100 | #320 | Tragic 86.6% |
| Puerto Ricans | 0.0 /100 | #321 | Tragic 86.5% |
| Central American Indians | 0.0 /100 | #322 | Tragic 86.5% |
| Yuman | 0.0 /100 | #323 | Tragic 86.5% |
| Immigrants | Cabo Verde | 0.0 /100 | #324 | Tragic 85.8% |
| Mexican American Indians | 0.0 /100 | #325 | Tragic 85.7% |