Immigrants from Bahamas vs Belizean Disability
COMPARE
Immigrants from Bahamas
Belizean
Disability
Disability Comparison
Immigrants from Bahamas
Belizeans
12.1%
DISABILITY
4.7/ 100
METRIC RATING
220th/ 347
METRIC RANK
11.9%
DISABILITY
12.8/ 100
METRIC RATING
200th/ 347
METRIC RANK
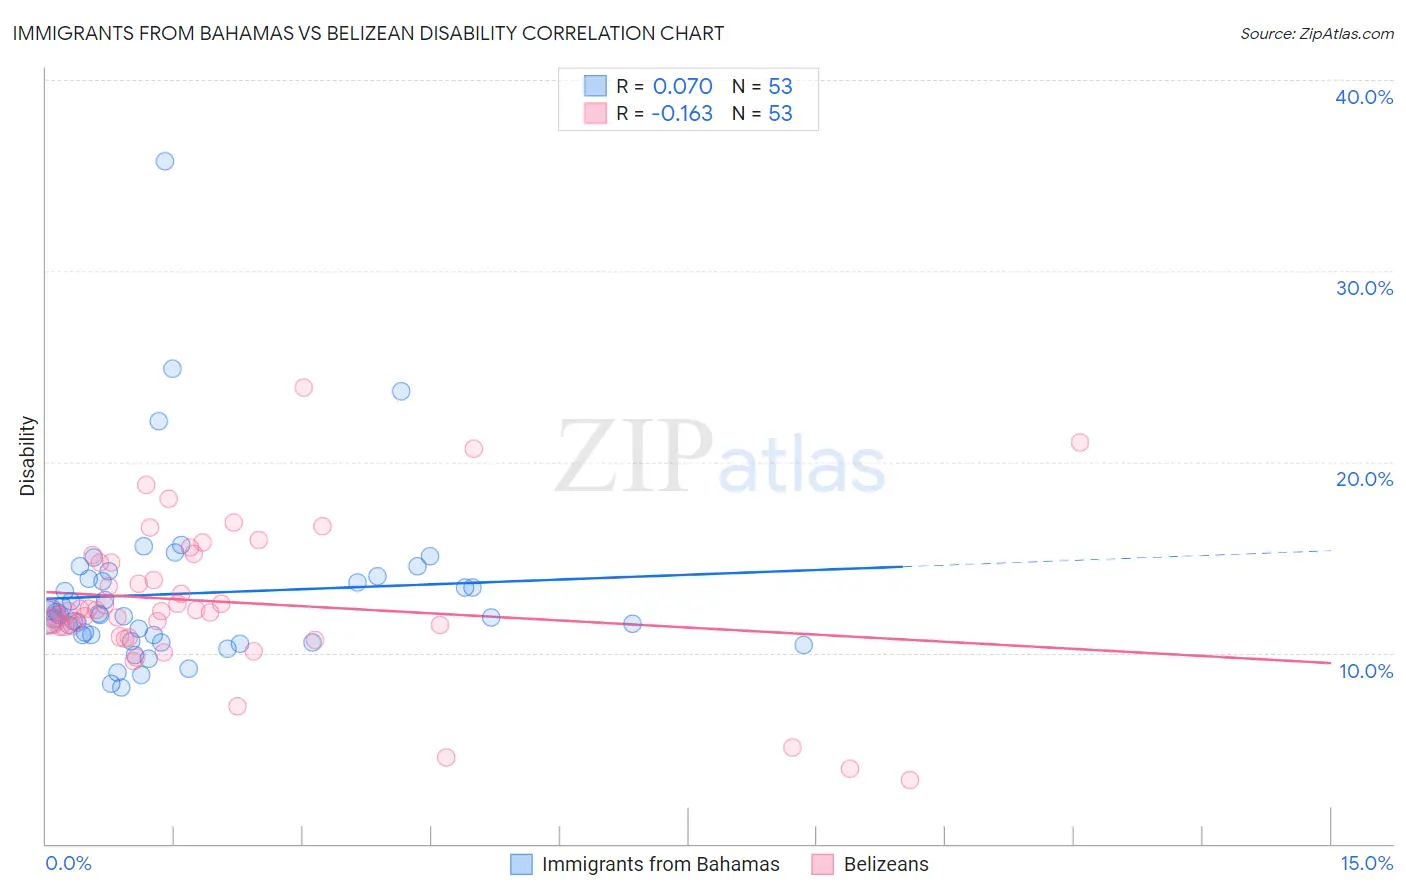
Immigrants from Bahamas vs Belizean Disability Correlation Chart
The statistical analysis conducted on geographies consisting of 104,655,290 people shows a slight positive correlation between the proportion of Immigrants from Bahamas and percentage of population with a disability in the United States with a correlation coefficient (R) of 0.070 and weighted average of 12.1%. Similarly, the statistical analysis conducted on geographies consisting of 144,197,719 people shows a poor negative correlation between the proportion of Belizeans and percentage of population with a disability in the United States with a correlation coefficient (R) of -0.163 and weighted average of 11.9%, a difference of 1.2%.
Disability Correlation Summary
| Measurement | Immigrants from Bahamas | Belizean |
| Minimum | 8.2% | 3.4% |
| Maximum | 35.8% | 23.9% |
| Range | 27.6% | 20.5% |
| Mean | 13.1% | 12.7% |
| Median | 12.0% | 12.2% |
| Interquartile 25% (IQ1) | 10.8% | 11.1% |
| Interquartile 75% (IQ3) | 14.0% | 14.9% |
| Interquartile Range (IQR) | 3.2% | 3.8% |
| Standard Deviation (Sample) | 4.6% | 3.9% |
| Standard Deviation (Population) | 4.5% | 3.9% |
Demographics Similar to Immigrants from Bahamas and Belizeans by Disability
In terms of disability, the demographic groups most similar to Immigrants from Bahamas are Croatian (12.1%, a difference of 0.040%), Immigrants from Jamaica (12.1%, a difference of 0.080%), Immigrants from North America (12.1%, a difference of 0.15%), Panamanian (12.1%, a difference of 0.16%), and Immigrants from Canada (12.1%, a difference of 0.30%). Similarly, the demographic groups most similar to Belizeans are Assyrian/Chaldean/Syriac (11.9%, a difference of 0.020%), Immigrants from England (12.0%, a difference of 0.090%), British West Indian (12.0%, a difference of 0.14%), Mexican American Indian (12.0%, a difference of 0.14%), and Immigrants from Western Europe (12.0%, a difference of 0.30%).
| Demographics | Rating | Rank | Disability |
| Belizeans | 12.8 /100 | #200 | Poor 11.9% |
| Assyrians/Chaldeans/Syriacs | 12.6 /100 | #201 | Poor 11.9% |
| Immigrants | England | 12.0 /100 | #202 | Poor 12.0% |
| British West Indians | 11.5 /100 | #203 | Poor 12.0% |
| Mexican American Indians | 11.4 /100 | #204 | Poor 12.0% |
| Immigrants | Western Europe | 10.1 /100 | #205 | Poor 12.0% |
| Immigrants | Senegal | 9.4 /100 | #206 | Tragic 12.0% |
| Immigrants | Thailand | 9.3 /100 | #207 | Tragic 12.0% |
| Immigrants | Caribbean | 9.1 /100 | #208 | Tragic 12.0% |
| Danes | 8.7 /100 | #209 | Tragic 12.0% |
| Czechs | 7.9 /100 | #210 | Tragic 12.0% |
| Immigrants | Cambodia | 7.3 /100 | #211 | Tragic 12.0% |
| Austrians | 7.2 /100 | #212 | Tragic 12.0% |
| Immigrants | Iraq | 7.1 /100 | #213 | Tragic 12.0% |
| Immigrants | Somalia | 6.8 /100 | #214 | Tragic 12.0% |
| Immigrants | Canada | 6.1 /100 | #215 | Tragic 12.1% |
| Panamanians | 5.4 /100 | #216 | Tragic 12.1% |
| Immigrants | North America | 5.3 /100 | #217 | Tragic 12.1% |
| Immigrants | Jamaica | 5.0 /100 | #218 | Tragic 12.1% |
| Croatians | 4.9 /100 | #219 | Tragic 12.1% |
| Immigrants | Bahamas | 4.7 /100 | #220 | Tragic 12.1% |