Kenyan vs Belizean Disability
COMPARE
Kenyan
Belizean
Disability
Disability Comparison
Kenyans
Belizeans
11.5%
DISABILITY
87.1/ 100
METRIC RATING
137th/ 347
METRIC RANK
11.9%
DISABILITY
12.8/ 100
METRIC RATING
200th/ 347
METRIC RANK
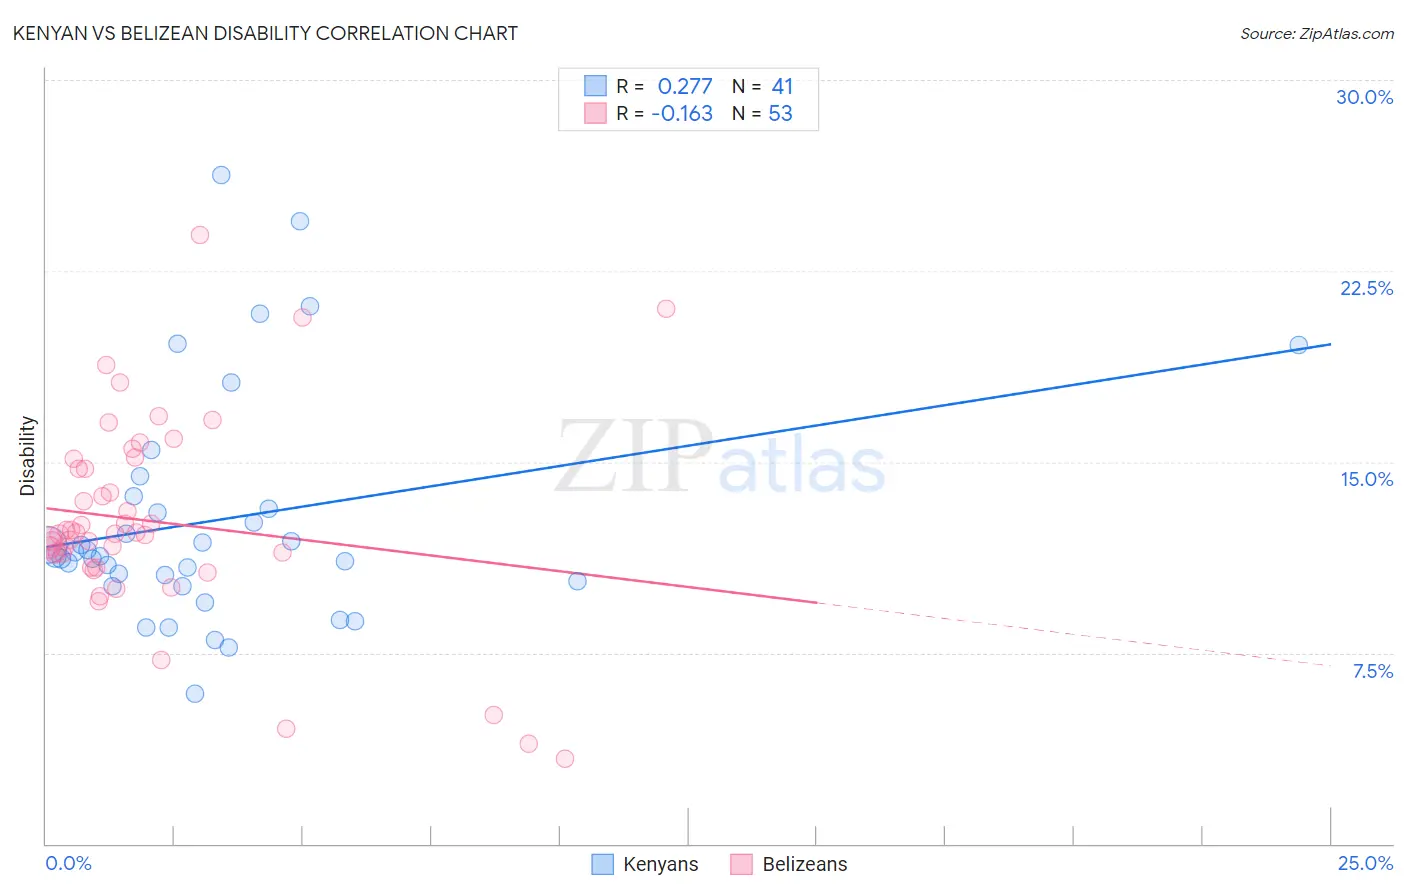
Kenyan vs Belizean Disability Correlation Chart
The statistical analysis conducted on geographies consisting of 168,214,038 people shows a weak positive correlation between the proportion of Kenyans and percentage of population with a disability in the United States with a correlation coefficient (R) of 0.277 and weighted average of 11.5%. Similarly, the statistical analysis conducted on geographies consisting of 144,197,719 people shows a poor negative correlation between the proportion of Belizeans and percentage of population with a disability in the United States with a correlation coefficient (R) of -0.163 and weighted average of 11.9%, a difference of 4.3%.
Disability Correlation Summary
| Measurement | Kenyan | Belizean |
| Minimum | 5.9% | 3.4% |
| Maximum | 26.2% | 23.9% |
| Range | 20.3% | 20.5% |
| Mean | 12.7% | 12.7% |
| Median | 11.3% | 12.2% |
| Interquartile 25% (IQ1) | 10.2% | 11.1% |
| Interquartile 75% (IQ3) | 13.4% | 14.9% |
| Interquartile Range (IQR) | 3.2% | 3.8% |
| Standard Deviation (Sample) | 4.5% | 3.9% |
| Standard Deviation (Population) | 4.5% | 3.9% |
Similar Demographics by Disability
Demographics Similar to Kenyans by Disability
In terms of disability, the demographic groups most similar to Kenyans are New Zealander (11.5%, a difference of 0.010%), Ghanaian (11.5%, a difference of 0.010%), Russian (11.5%, a difference of 0.030%), Immigrants from St. Vincent and the Grenadines (11.4%, a difference of 0.070%), and Ugandan (11.4%, a difference of 0.080%).
| Demographics | Rating | Rank | Disability |
| Latvians | 89.8 /100 | #130 | Excellent 11.4% |
| Immigrants | Croatia | 89.8 /100 | #131 | Excellent 11.4% |
| Immigrants | Africa | 89.3 /100 | #132 | Excellent 11.4% |
| Arabs | 89.1 /100 | #133 | Excellent 11.4% |
| Immigrants | Guyana | 88.3 /100 | #134 | Excellent 11.4% |
| Ugandans | 87.9 /100 | #135 | Excellent 11.4% |
| Immigrants | St. Vincent and the Grenadines | 87.8 /100 | #136 | Excellent 11.4% |
| Kenyans | 87.1 /100 | #137 | Excellent 11.5% |
| New Zealanders | 87.0 /100 | #138 | Excellent 11.5% |
| Ghanaians | 87.0 /100 | #139 | Excellent 11.5% |
| Russians | 86.8 /100 | #140 | Excellent 11.5% |
| Immigrants | Grenada | 86.1 /100 | #141 | Excellent 11.5% |
| Immigrants | Sudan | 85.3 /100 | #142 | Excellent 11.5% |
| Moroccans | 83.3 /100 | #143 | Excellent 11.5% |
| Australians | 82.5 /100 | #144 | Excellent 11.5% |
Demographics Similar to Belizeans by Disability
In terms of disability, the demographic groups most similar to Belizeans are Assyrian/Chaldean/Syriac (11.9%, a difference of 0.020%), Immigrants from England (12.0%, a difference of 0.090%), British West Indian (12.0%, a difference of 0.14%), Mexican American Indian (12.0%, a difference of 0.14%), and Immigrants from Panama (11.9%, a difference of 0.16%).
| Demographics | Rating | Rank | Disability |
| Immigrants | Bosnia and Herzegovina | 18.0 /100 | #193 | Poor 11.9% |
| Somalis | 17.3 /100 | #194 | Poor 11.9% |
| Barbadians | 15.8 /100 | #195 | Poor 11.9% |
| Serbians | 15.4 /100 | #196 | Poor 11.9% |
| Immigrants | Belize | 15.2 /100 | #197 | Poor 11.9% |
| Ukrainians | 14.7 /100 | #198 | Poor 11.9% |
| Immigrants | Panama | 14.6 /100 | #199 | Poor 11.9% |
| Belizeans | 12.8 /100 | #200 | Poor 11.9% |
| Assyrians/Chaldeans/Syriacs | 12.6 /100 | #201 | Poor 11.9% |
| Immigrants | England | 12.0 /100 | #202 | Poor 12.0% |
| British West Indians | 11.5 /100 | #203 | Poor 12.0% |
| Mexican American Indians | 11.4 /100 | #204 | Poor 12.0% |
| Immigrants | Western Europe | 10.1 /100 | #205 | Poor 12.0% |
| Immigrants | Senegal | 9.4 /100 | #206 | Tragic 12.0% |
| Immigrants | Thailand | 9.3 /100 | #207 | Tragic 12.0% |