Immigrants from Mexico vs Welsh In Labor Force | Age 45-54
COMPARE
Immigrants from Mexico
Welsh
In Labor Force | Age 45-54
In Labor Force | Age 45-54 Comparison
Immigrants from Mexico
Welsh
79.7%
IN LABOR FORCE | AGE 45-54
0.0/ 100
METRIC RATING
312th/ 347
METRIC RANK
82.3%
IN LABOR FORCE | AGE 45-54
9.2/ 100
METRIC RATING
206th/ 347
METRIC RANK
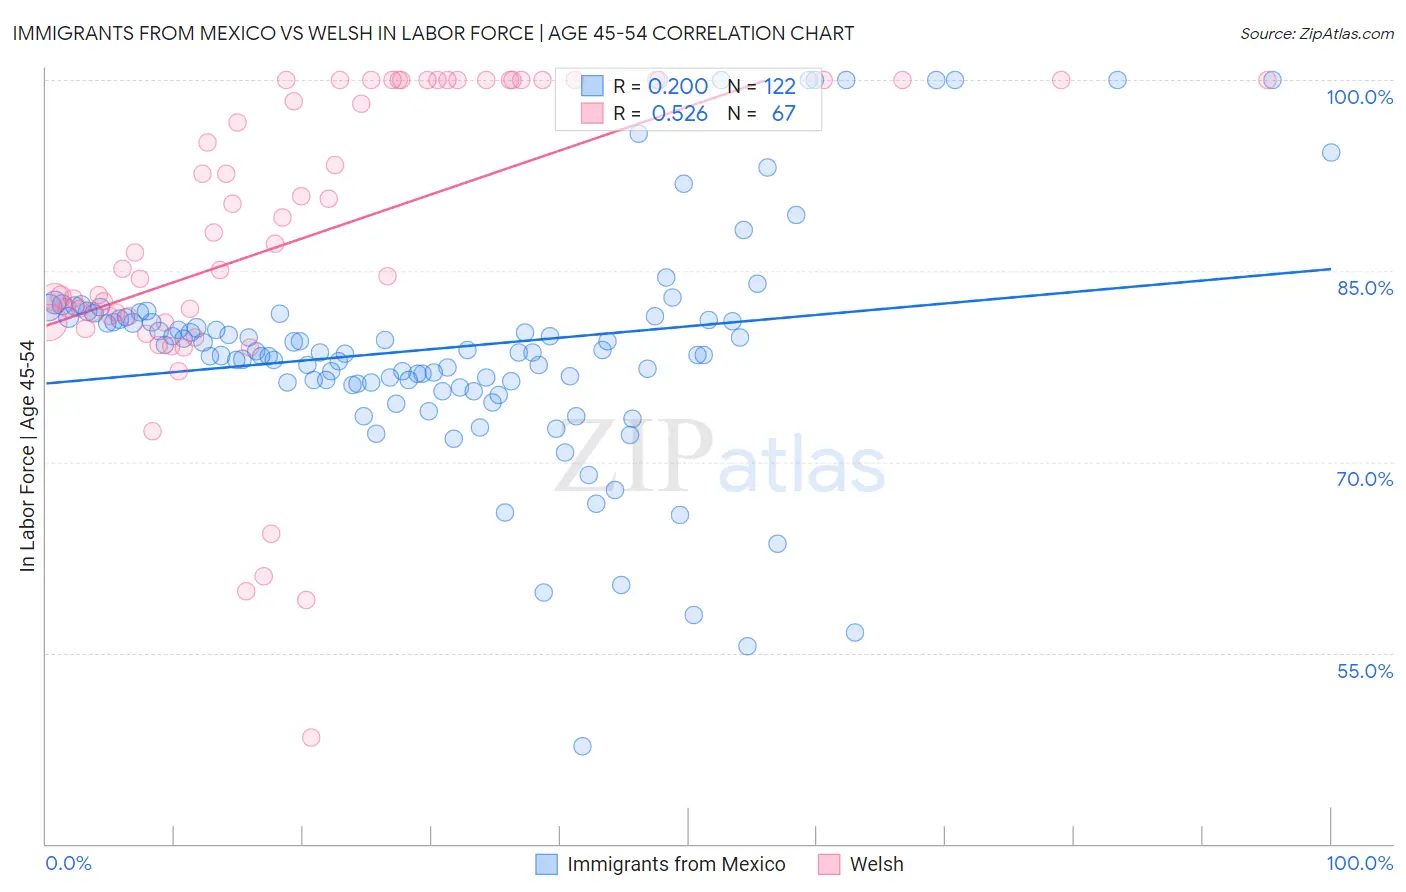
Immigrants from Mexico vs Welsh In Labor Force | Age 45-54 Correlation Chart
The statistical analysis conducted on geographies consisting of 513,319,268 people shows a poor positive correlation between the proportion of Immigrants from Mexico and labor force participation rate among population between the ages 45 and 54 in the United States with a correlation coefficient (R) of 0.200 and weighted average of 79.7%. Similarly, the statistical analysis conducted on geographies consisting of 528,109,261 people shows a substantial positive correlation between the proportion of Welsh and labor force participation rate among population between the ages 45 and 54 in the United States with a correlation coefficient (R) of 0.526 and weighted average of 82.3%, a difference of 3.3%.
In Labor Force | Age 45-54 Correlation Summary
| Measurement | Immigrants from Mexico | Welsh |
| Minimum | 47.6% | 48.4% |
| Maximum | 100.0% | 100.0% |
| Range | 52.4% | 51.6% |
| Mean | 79.0% | 87.7% |
| Median | 78.6% | 87.2% |
| Interquartile 25% (IQ1) | 76.2% | 81.4% |
| Interquartile 75% (IQ3) | 81.4% | 100.0% |
| Interquartile Range (IQR) | 5.2% | 18.6% |
| Standard Deviation (Sample) | 9.1% | 11.9% |
| Standard Deviation (Population) | 9.1% | 11.8% |
Similar Demographics by In Labor Force | Age 45-54
Demographics Similar to Immigrants from Mexico by In Labor Force | Age 45-54
In terms of in labor force | age 45-54, the demographic groups most similar to Immigrants from Mexico are Mexican (79.8%, a difference of 0.14%), Colville (79.5%, a difference of 0.24%), Inupiat (79.9%, a difference of 0.25%), Ottawa (79.5%, a difference of 0.28%), and Potawatomi (80.0%, a difference of 0.34%).
| Demographics | Rating | Rank | In Labor Force | Age 45-54 |
| Immigrants | Dominican Republic | 0.0 /100 | #305 | Tragic 80.1% |
| Spanish Americans | 0.0 /100 | #306 | Tragic 80.1% |
| Blackfeet | 0.0 /100 | #307 | Tragic 80.0% |
| Central American Indians | 0.0 /100 | #308 | Tragic 80.0% |
| Potawatomi | 0.0 /100 | #309 | Tragic 80.0% |
| Inupiat | 0.0 /100 | #310 | Tragic 79.9% |
| Mexicans | 0.0 /100 | #311 | Tragic 79.8% |
| Immigrants | Mexico | 0.0 /100 | #312 | Tragic 79.7% |
| Colville | 0.0 /100 | #313 | Tragic 79.5% |
| Ottawa | 0.0 /100 | #314 | Tragic 79.5% |
| Blacks/African Americans | 0.0 /100 | #315 | Tragic 79.3% |
| Shoshone | 0.0 /100 | #316 | Tragic 79.3% |
| Comanche | 0.0 /100 | #317 | Tragic 79.2% |
| Chickasaw | 0.0 /100 | #318 | Tragic 79.0% |
| Cherokee | 0.0 /100 | #319 | Tragic 79.0% |
Demographics Similar to Welsh by In Labor Force | Age 45-54
In terms of in labor force | age 45-54, the demographic groups most similar to Welsh are Senegalese (82.4%, a difference of 0.010%), Immigrants from Cabo Verde (82.3%, a difference of 0.020%), Native Hawaiian (82.3%, a difference of 0.020%), Immigrants from Western Europe (82.4%, a difference of 0.040%), and Immigrants from Lebanon (82.3%, a difference of 0.050%).
| Demographics | Rating | Rank | In Labor Force | Age 45-54 |
| Moroccans | 15.7 /100 | #199 | Poor 82.5% |
| French Canadians | 15.4 /100 | #200 | Poor 82.5% |
| Canadians | 15.1 /100 | #201 | Poor 82.4% |
| Immigrants | Western Asia | 14.9 /100 | #202 | Poor 82.4% |
| Arabs | 11.6 /100 | #203 | Poor 82.4% |
| Immigrants | Western Europe | 10.9 /100 | #204 | Poor 82.4% |
| Senegalese | 9.5 /100 | #205 | Tragic 82.4% |
| Welsh | 9.2 /100 | #206 | Tragic 82.3% |
| Immigrants | Cabo Verde | 8.6 /100 | #207 | Tragic 82.3% |
| Native Hawaiians | 8.5 /100 | #208 | Tragic 82.3% |
| Immigrants | Lebanon | 7.4 /100 | #209 | Tragic 82.3% |
| Immigrants | Bahamas | 7.1 /100 | #210 | Tragic 82.3% |
| Immigrants | Syria | 6.6 /100 | #211 | Tragic 82.3% |
| Ecuadorians | 6.3 /100 | #212 | Tragic 82.3% |
| Immigrants | Uzbekistan | 5.8 /100 | #213 | Tragic 82.3% |