Immigrants from Mexico vs Immigrants from Bolivia Male Disability
COMPARE
Immigrants from Mexico
Immigrants from Bolivia
Male Disability
Male Disability Comparison
Immigrants from Mexico
Immigrants from Bolivia
11.5%
MALE DISABILITY
12.6/ 100
METRIC RATING
202nd/ 347
METRIC RANK
9.5%
MALE DISABILITY
100.0/ 100
METRIC RATING
7th/ 347
METRIC RANK
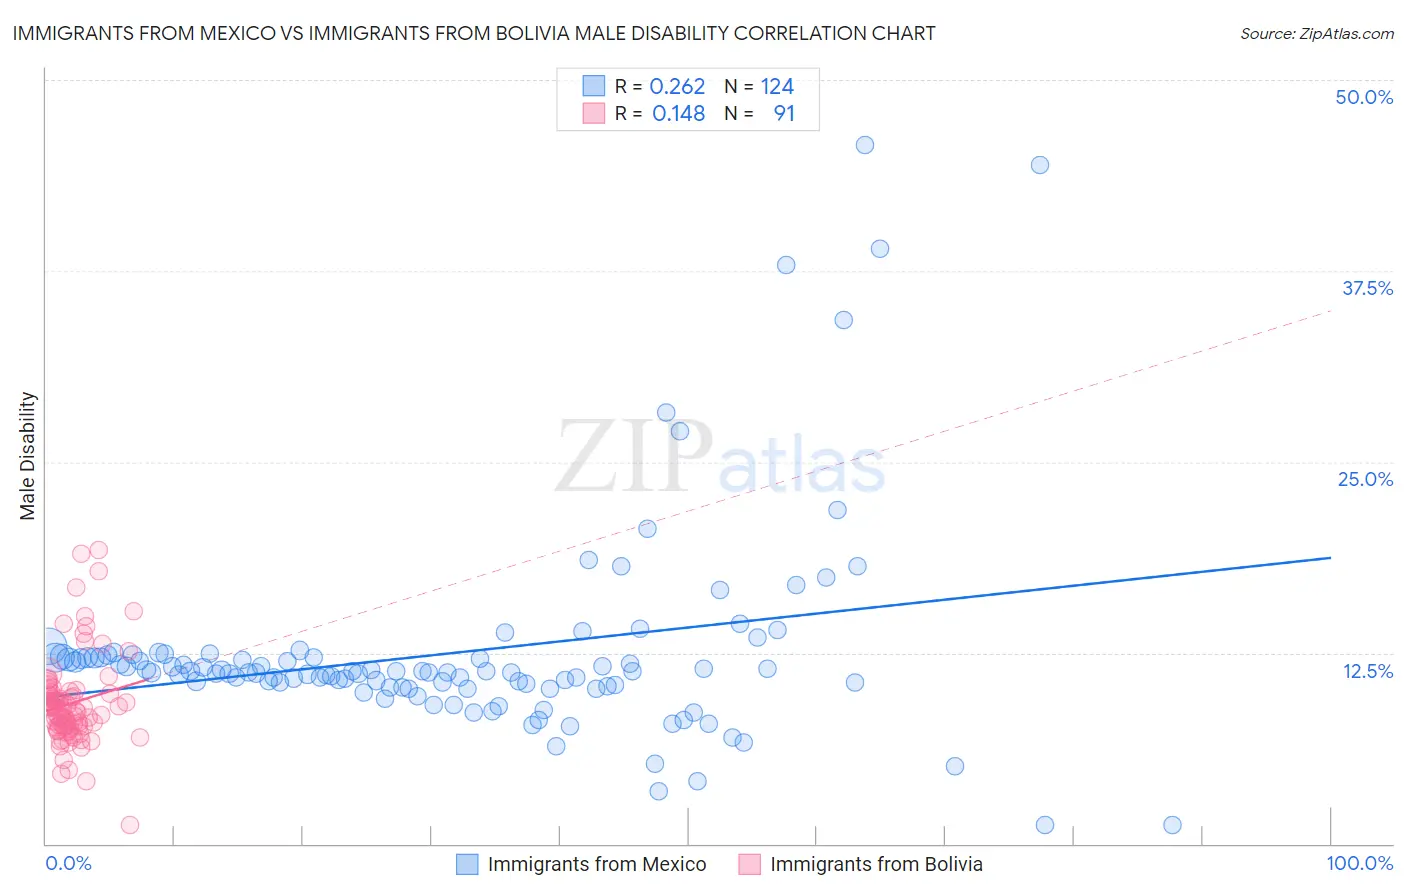
Immigrants from Mexico vs Immigrants from Bolivia Male Disability Correlation Chart
The statistical analysis conducted on geographies consisting of 513,525,240 people shows a weak positive correlation between the proportion of Immigrants from Mexico and percentage of males with a disability in the United States with a correlation coefficient (R) of 0.262 and weighted average of 11.5%. Similarly, the statistical analysis conducted on geographies consisting of 158,713,247 people shows a poor positive correlation between the proportion of Immigrants from Bolivia and percentage of males with a disability in the United States with a correlation coefficient (R) of 0.148 and weighted average of 9.5%, a difference of 21.7%.
Male Disability Correlation Summary
| Measurement | Immigrants from Mexico | Immigrants from Bolivia |
| Minimum | 1.2% | 1.2% |
| Maximum | 45.8% | 19.2% |
| Range | 44.6% | 18.0% |
| Mean | 12.5% | 9.2% |
| Median | 11.2% | 8.8% |
| Interquartile 25% (IQ1) | 10.3% | 7.7% |
| Interquartile 75% (IQ3) | 12.2% | 9.9% |
| Interquartile Range (IQR) | 1.9% | 2.2% |
| Standard Deviation (Sample) | 6.8% | 3.0% |
| Standard Deviation (Population) | 6.8% | 3.0% |
Similar Demographics by Male Disability
Demographics Similar to Immigrants from Mexico by Male Disability
In terms of male disability, the demographic groups most similar to Immigrants from Mexico are Immigrants from Iraq (11.5%, a difference of 0.040%), Immigrants from Panama (11.5%, a difference of 0.040%), Jamaican (11.5%, a difference of 0.23%), Immigrants from Cambodia (11.5%, a difference of 0.25%), and Serbian (11.5%, a difference of 0.25%).
| Demographics | Rating | Rank | Male Disability |
| Immigrants | Oceania | 20.9 /100 | #195 | Fair 11.4% |
| West Indians | 18.4 /100 | #196 | Poor 11.4% |
| Somalis | 18.2 /100 | #197 | Poor 11.4% |
| Immigrants | Jamaica | 16.3 /100 | #198 | Poor 11.5% |
| Lebanese | 15.4 /100 | #199 | Poor 11.5% |
| Immigrants | Iraq | 13.0 /100 | #200 | Poor 11.5% |
| Immigrants | Panama | 13.0 /100 | #201 | Poor 11.5% |
| Immigrants | Mexico | 12.6 /100 | #202 | Poor 11.5% |
| Jamaicans | 10.9 /100 | #203 | Poor 11.5% |
| Immigrants | Cambodia | 10.8 /100 | #204 | Poor 11.5% |
| Serbians | 10.7 /100 | #205 | Poor 11.5% |
| Ukrainians | 10.6 /100 | #206 | Poor 11.5% |
| Immigrants | Somalia | 10.4 /100 | #207 | Poor 11.5% |
| Icelanders | 10.1 /100 | #208 | Poor 11.6% |
| Spanish American Indians | 10.1 /100 | #209 | Poor 11.6% |
Demographics Similar to Immigrants from Bolivia by Male Disability
In terms of male disability, the demographic groups most similar to Immigrants from Bolivia are Immigrants from South Central Asia (9.4%, a difference of 0.33%), Immigrants from Hong Kong (9.4%, a difference of 0.39%), Immigrants from China (9.5%, a difference of 0.60%), Immigrants from Singapore (9.5%, a difference of 0.68%), and Immigrants from Israel (9.6%, a difference of 1.1%).
| Demographics | Rating | Rank | Male Disability |
| Immigrants | India | 100.0 /100 | #1 | Exceptional 9.0% |
| Immigrants | Taiwan | 100.0 /100 | #2 | Exceptional 9.1% |
| Filipinos | 100.0 /100 | #3 | Exceptional 9.1% |
| Thais | 100.0 /100 | #4 | Exceptional 9.2% |
| Immigrants | Hong Kong | 100.0 /100 | #5 | Exceptional 9.4% |
| Immigrants | South Central Asia | 100.0 /100 | #6 | Exceptional 9.4% |
| Immigrants | Bolivia | 100.0 /100 | #7 | Exceptional 9.5% |
| Immigrants | China | 100.0 /100 | #8 | Exceptional 9.5% |
| Immigrants | Singapore | 100.0 /100 | #9 | Exceptional 9.5% |
| Immigrants | Israel | 100.0 /100 | #10 | Exceptional 9.6% |
| Immigrants | Eastern Asia | 100.0 /100 | #11 | Exceptional 9.6% |
| Bolivians | 100.0 /100 | #12 | Exceptional 9.6% |
| Iranians | 100.0 /100 | #13 | Exceptional 9.7% |
| Immigrants | Iran | 100.0 /100 | #14 | Exceptional 9.7% |
| Indians (Asian) | 100.0 /100 | #15 | Exceptional 9.7% |