Immigrants from Mexico vs Sudanese Male Disability
COMPARE
Immigrants from Mexico
Sudanese
Male Disability
Male Disability Comparison
Immigrants from Mexico
Sudanese
11.5%
MALE DISABILITY
12.6/ 100
METRIC RATING
202nd/ 347
METRIC RANK
11.0%
MALE DISABILITY
77.1/ 100
METRIC RATING
148th/ 347
METRIC RANK
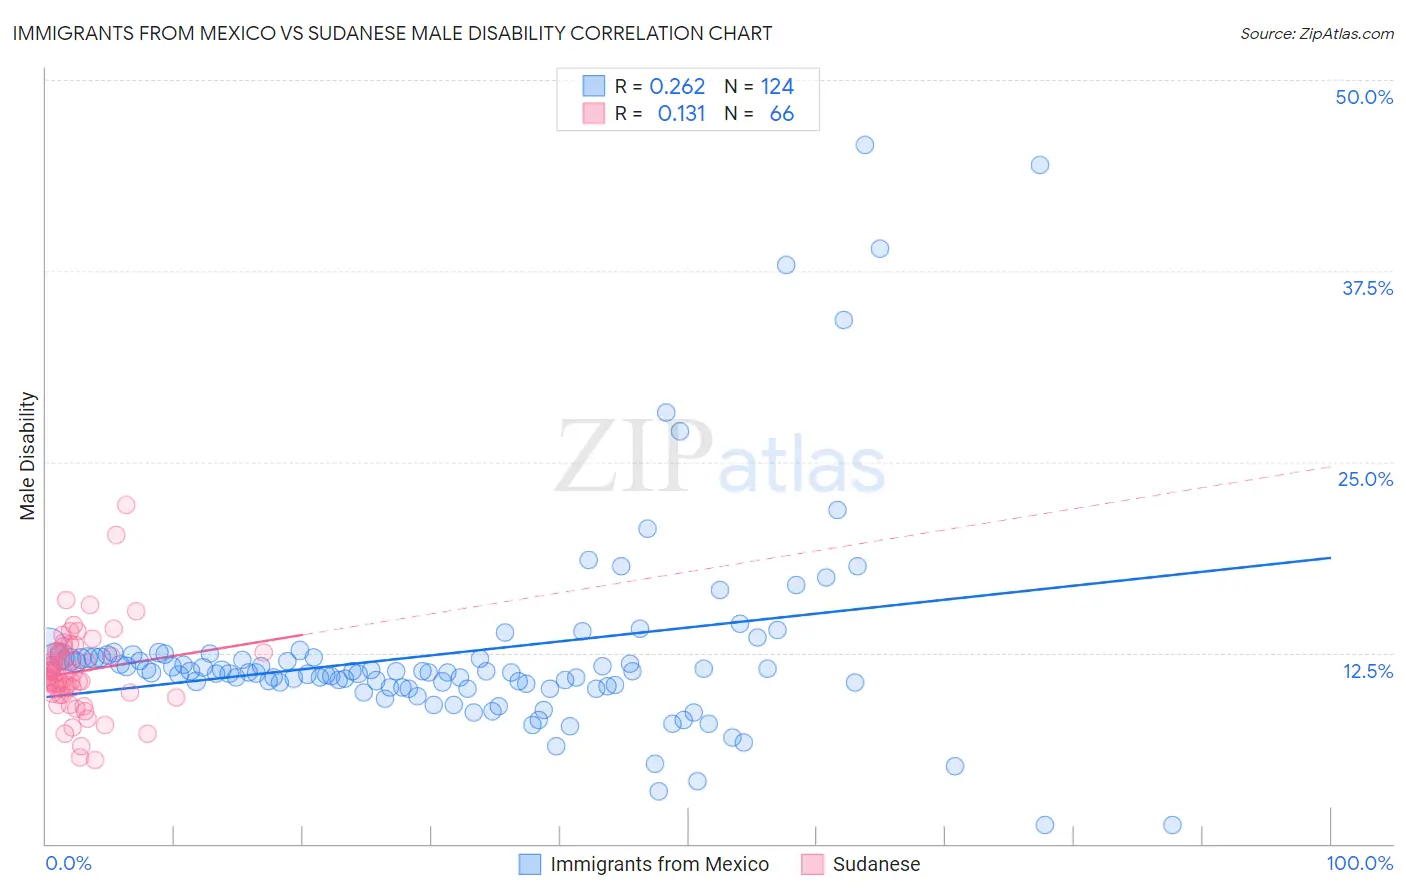
Immigrants from Mexico vs Sudanese Male Disability Correlation Chart
The statistical analysis conducted on geographies consisting of 513,525,240 people shows a weak positive correlation between the proportion of Immigrants from Mexico and percentage of males with a disability in the United States with a correlation coefficient (R) of 0.262 and weighted average of 11.5%. Similarly, the statistical analysis conducted on geographies consisting of 110,141,954 people shows a poor positive correlation between the proportion of Sudanese and percentage of males with a disability in the United States with a correlation coefficient (R) of 0.131 and weighted average of 11.0%, a difference of 4.4%.
Male Disability Correlation Summary
| Measurement | Immigrants from Mexico | Sudanese |
| Minimum | 1.2% | 5.5% |
| Maximum | 45.8% | 22.1% |
| Range | 44.6% | 16.7% |
| Mean | 12.5% | 11.3% |
| Median | 11.2% | 11.1% |
| Interquartile 25% (IQ1) | 10.3% | 9.8% |
| Interquartile 75% (IQ3) | 12.2% | 12.6% |
| Interquartile Range (IQR) | 1.9% | 2.7% |
| Standard Deviation (Sample) | 6.8% | 2.8% |
| Standard Deviation (Population) | 6.8% | 2.8% |
Similar Demographics by Male Disability
Demographics Similar to Immigrants from Mexico by Male Disability
In terms of male disability, the demographic groups most similar to Immigrants from Mexico are Immigrants from Iraq (11.5%, a difference of 0.040%), Immigrants from Panama (11.5%, a difference of 0.040%), Jamaican (11.5%, a difference of 0.23%), Immigrants from Cambodia (11.5%, a difference of 0.25%), and Serbian (11.5%, a difference of 0.25%).
| Demographics | Rating | Rank | Male Disability |
| Immigrants | Oceania | 20.9 /100 | #195 | Fair 11.4% |
| West Indians | 18.4 /100 | #196 | Poor 11.4% |
| Somalis | 18.2 /100 | #197 | Poor 11.4% |
| Immigrants | Jamaica | 16.3 /100 | #198 | Poor 11.5% |
| Lebanese | 15.4 /100 | #199 | Poor 11.5% |
| Immigrants | Iraq | 13.0 /100 | #200 | Poor 11.5% |
| Immigrants | Panama | 13.0 /100 | #201 | Poor 11.5% |
| Immigrants | Mexico | 12.6 /100 | #202 | Poor 11.5% |
| Jamaicans | 10.9 /100 | #203 | Poor 11.5% |
| Immigrants | Cambodia | 10.8 /100 | #204 | Poor 11.5% |
| Serbians | 10.7 /100 | #205 | Poor 11.5% |
| Ukrainians | 10.6 /100 | #206 | Poor 11.5% |
| Immigrants | Somalia | 10.4 /100 | #207 | Poor 11.5% |
| Icelanders | 10.1 /100 | #208 | Poor 11.6% |
| Spanish American Indians | 10.1 /100 | #209 | Poor 11.6% |
Demographics Similar to Sudanese by Male Disability
In terms of male disability, the demographic groups most similar to Sudanese are Immigrants from Croatia (11.0%, a difference of 0.010%), Korean (11.0%, a difference of 0.030%), Immigrants from Denmark (11.0%, a difference of 0.060%), Costa Rican (11.0%, a difference of 0.070%), and Kenyan (11.0%, a difference of 0.080%).
| Demographics | Rating | Rank | Male Disability |
| Arabs | 81.5 /100 | #141 | Excellent 11.0% |
| Immigrants | Sudan | 81.5 /100 | #142 | Excellent 11.0% |
| Moroccans | 80.7 /100 | #143 | Excellent 11.0% |
| Kenyans | 78.1 /100 | #144 | Good 11.0% |
| Costa Ricans | 78.0 /100 | #145 | Good 11.0% |
| Koreans | 77.5 /100 | #146 | Good 11.0% |
| Immigrants | Croatia | 77.3 /100 | #147 | Good 11.0% |
| Sudanese | 77.1 /100 | #148 | Good 11.0% |
| Immigrants | Denmark | 76.4 /100 | #149 | Good 11.0% |
| Immigrants | Guatemala | 75.1 /100 | #150 | Good 11.0% |
| Cubans | 74.9 /100 | #151 | Good 11.0% |
| Immigrants | Albania | 74.4 /100 | #152 | Good 11.0% |
| Immigrants | Northern Europe | 73.2 /100 | #153 | Good 11.1% |
| Immigrants | Moldova | 72.8 /100 | #154 | Good 11.1% |
| Immigrants | Middle Africa | 70.9 /100 | #155 | Good 11.1% |