Immigrants from Lithuania vs Immigrants Disability
COMPARE
Immigrants from Lithuania
Immigrants
Disability
Disability Comparison
Immigrants from Lithuania
Immigrants
10.9%
DISABILITY
99.8/ 100
METRIC RATING
56th/ 347
METRIC RANK
11.3%
DISABILITY
96.4/ 100
METRIC RATING
104th/ 347
METRIC RANK
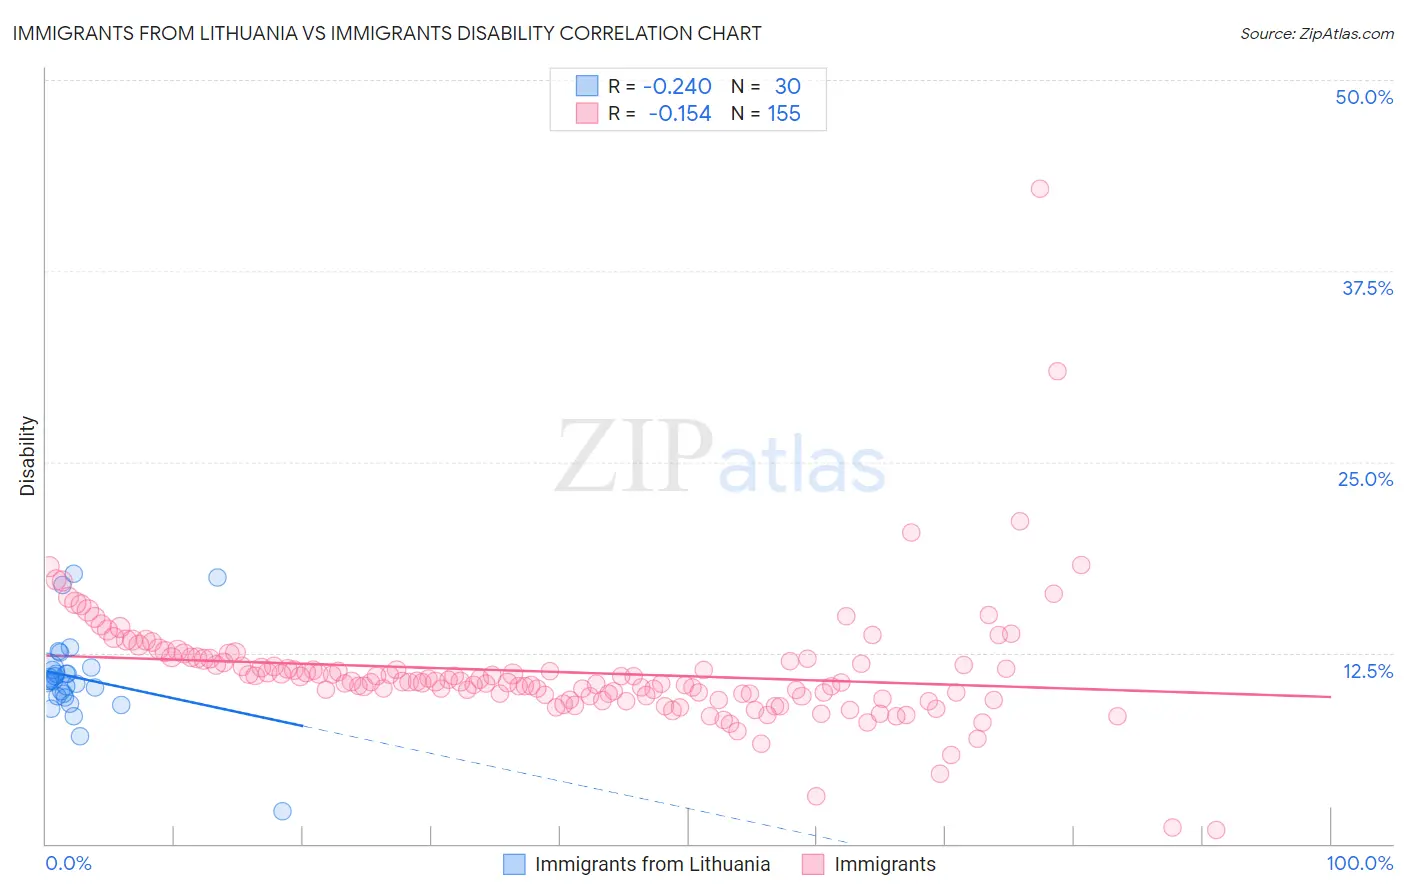
Immigrants from Lithuania vs Immigrants Disability Correlation Chart
The statistical analysis conducted on geographies consisting of 117,724,932 people shows a weak negative correlation between the proportion of Immigrants from Lithuania and percentage of population with a disability in the United States with a correlation coefficient (R) of -0.240 and weighted average of 10.9%. Similarly, the statistical analysis conducted on geographies consisting of 577,602,832 people shows a poor negative correlation between the proportion of Immigrants and percentage of population with a disability in the United States with a correlation coefficient (R) of -0.154 and weighted average of 11.3%, a difference of 3.5%.
Disability Correlation Summary
| Measurement | Immigrants from Lithuania | Immigrants |
| Minimum | 2.1% | 0.89% |
| Maximum | 17.7% | 42.9% |
| Range | 15.5% | 42.0% |
| Mean | 10.9% | 11.3% |
| Median | 10.6% | 10.6% |
| Interquartile 25% (IQ1) | 9.6% | 9.7% |
| Interquartile 75% (IQ3) | 11.4% | 12.1% |
| Interquartile Range (IQR) | 1.7% | 2.4% |
| Standard Deviation (Sample) | 2.9% | 4.1% |
| Standard Deviation (Population) | 2.9% | 4.1% |
Similar Demographics by Disability
Demographics Similar to Immigrants from Lithuania by Disability
In terms of disability, the demographic groups most similar to Immigrants from Lithuania are Immigrants from El Salvador (10.9%, a difference of 0.11%), Immigrants from Spain (10.9%, a difference of 0.20%), Jordanian (10.9%, a difference of 0.20%), South American (10.9%, a difference of 0.22%), and Salvadoran (10.9%, a difference of 0.24%).
| Demographics | Rating | Rank | Disability |
| Vietnamese | 99.9 /100 | #49 | Exceptional 10.9% |
| Immigrants | Saudi Arabia | 99.9 /100 | #50 | Exceptional 10.9% |
| Peruvians | 99.8 /100 | #51 | Exceptional 10.9% |
| South Americans | 99.8 /100 | #52 | Exceptional 10.9% |
| Immigrants | Spain | 99.8 /100 | #53 | Exceptional 10.9% |
| Jordanians | 99.8 /100 | #54 | Exceptional 10.9% |
| Immigrants | El Salvador | 99.8 /100 | #55 | Exceptional 10.9% |
| Immigrants | Lithuania | 99.8 /100 | #56 | Exceptional 10.9% |
| Salvadorans | 99.8 /100 | #57 | Exceptional 10.9% |
| Immigrants | South America | 99.8 /100 | #58 | Exceptional 10.9% |
| Immigrants | Colombia | 99.7 /100 | #59 | Exceptional 10.9% |
| Zimbabweans | 99.7 /100 | #60 | Exceptional 10.9% |
| Immigrants | Bulgaria | 99.7 /100 | #61 | Exceptional 10.9% |
| Immigrants | Northern Africa | 99.7 /100 | #62 | Exceptional 10.9% |
| Immigrants | Eritrea | 99.7 /100 | #63 | Exceptional 11.0% |
Demographics Similar to Immigrants by Disability
In terms of disability, the demographic groups most similar to Immigrants are Immigrants from Uruguay (11.3%, a difference of 0.010%), Immigrants from Kazakhstan (11.3%, a difference of 0.010%), Immigrants from Eastern Europe (11.3%, a difference of 0.040%), Nicaraguan (11.3%, a difference of 0.060%), and Immigrants from Eastern Africa (11.3%, a difference of 0.080%).
| Demographics | Rating | Rank | Disability |
| Bhutanese | 97.4 /100 | #97 | Exceptional 11.2% |
| Uruguayans | 97.4 /100 | #98 | Exceptional 11.2% |
| Immigrants | Czechoslovakia | 97.4 /100 | #99 | Exceptional 11.2% |
| Immigrants | Greece | 96.9 /100 | #100 | Exceptional 11.3% |
| Immigrants | Nicaragua | 96.8 /100 | #101 | Exceptional 11.3% |
| Immigrants | Eastern Africa | 96.7 /100 | #102 | Exceptional 11.3% |
| Immigrants | Uruguay | 96.4 /100 | #103 | Exceptional 11.3% |
| Immigrants | Immigrants | 96.4 /100 | #104 | Exceptional 11.3% |
| Immigrants | Kazakhstan | 96.4 /100 | #105 | Exceptional 11.3% |
| Immigrants | Eastern Europe | 96.3 /100 | #106 | Exceptional 11.3% |
| Nicaraguans | 96.2 /100 | #107 | Exceptional 11.3% |
| Immigrants | Nigeria | 96.0 /100 | #108 | Exceptional 11.3% |
| Immigrants | Uganda | 95.7 /100 | #109 | Exceptional 11.3% |
| Immigrants | Denmark | 95.6 /100 | #110 | Exceptional 11.3% |
| Immigrants | South Eastern Asia | 95.4 /100 | #111 | Exceptional 11.3% |