Immigrants from Lithuania vs Sierra Leonean Disability
COMPARE
Immigrants from Lithuania
Sierra Leonean
Disability
Disability Comparison
Immigrants from Lithuania
Sierra Leoneans
10.9%
DISABILITY
99.8/ 100
METRIC RATING
56th/ 347
METRIC RANK
11.0%
DISABILITY
99.3/ 100
METRIC RATING
76th/ 347
METRIC RANK
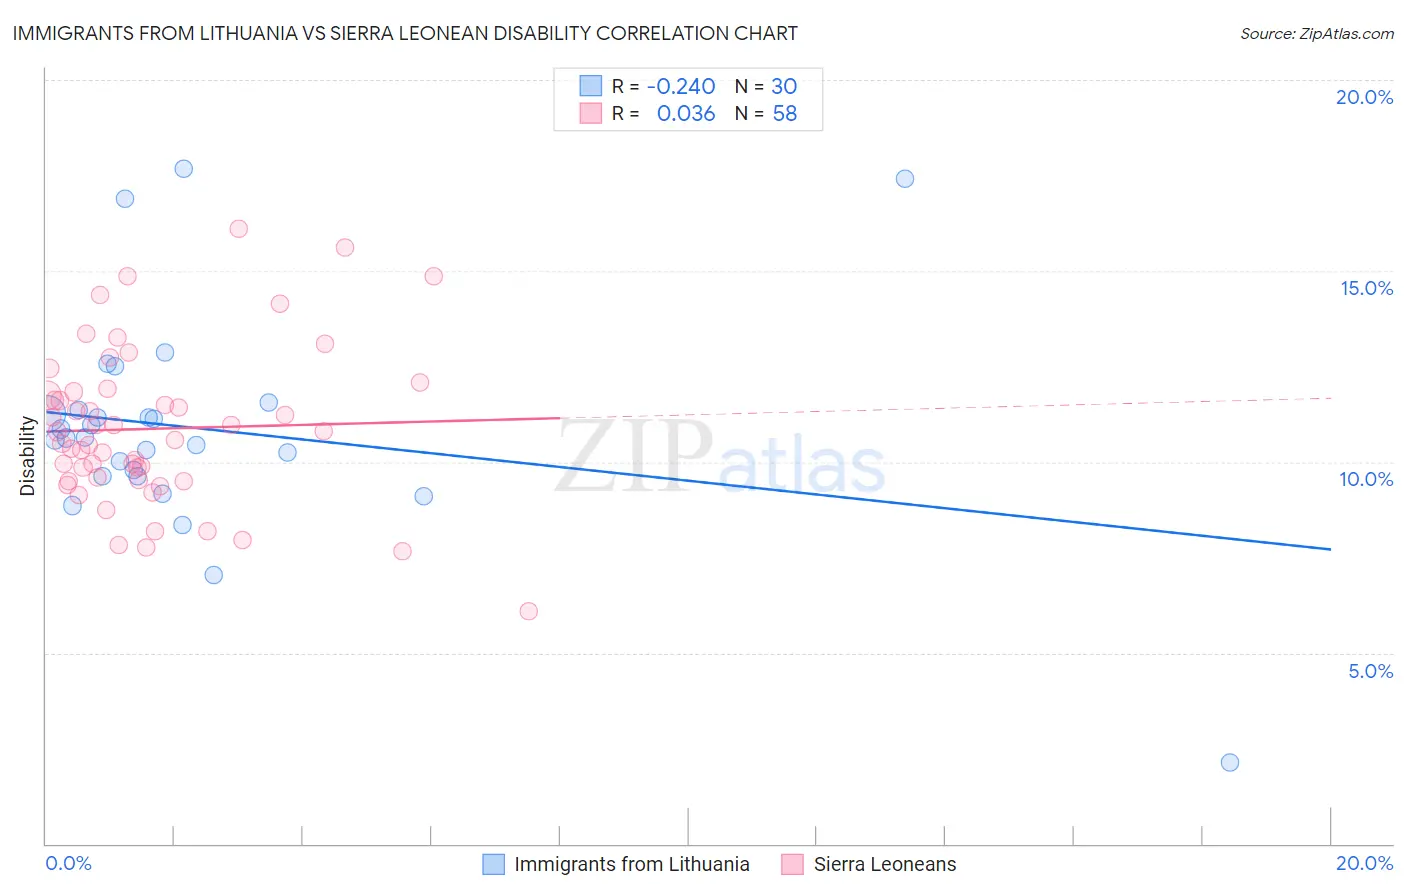
Immigrants from Lithuania vs Sierra Leonean Disability Correlation Chart
The statistical analysis conducted on geographies consisting of 117,724,932 people shows a weak negative correlation between the proportion of Immigrants from Lithuania and percentage of population with a disability in the United States with a correlation coefficient (R) of -0.240 and weighted average of 10.9%. Similarly, the statistical analysis conducted on geographies consisting of 83,353,853 people shows no correlation between the proportion of Sierra Leoneans and percentage of population with a disability in the United States with a correlation coefficient (R) of 0.036 and weighted average of 11.0%, a difference of 1.5%.
Disability Correlation Summary
| Measurement | Immigrants from Lithuania | Sierra Leonean |
| Minimum | 2.1% | 6.1% |
| Maximum | 17.7% | 16.1% |
| Range | 15.5% | 10.0% |
| Mean | 10.9% | 10.9% |
| Median | 10.6% | 10.7% |
| Interquartile 25% (IQ1) | 9.6% | 9.5% |
| Interquartile 75% (IQ3) | 11.4% | 11.8% |
| Interquartile Range (IQR) | 1.7% | 2.3% |
| Standard Deviation (Sample) | 2.9% | 2.1% |
| Standard Deviation (Population) | 2.9% | 2.0% |
Demographics Similar to Immigrants from Lithuania and Sierra Leoneans by Disability
In terms of disability, the demographic groups most similar to Immigrants from Lithuania are Salvadoran (10.9%, a difference of 0.24%), Immigrants from South America (10.9%, a difference of 0.27%), Immigrants from Colombia (10.9%, a difference of 0.36%), Zimbabwean (10.9%, a difference of 0.46%), and Immigrants from Bulgaria (10.9%, a difference of 0.51%). Similarly, the demographic groups most similar to Sierra Leoneans are Immigrants from Vietnam (11.0%, a difference of 0.030%), Immigrants from Serbia (11.0%, a difference of 0.050%), Immigrants from Bangladesh (11.0%, a difference of 0.070%), Immigrants from Chile (11.0%, a difference of 0.090%), and Immigrants from Lebanon (11.0%, a difference of 0.18%).
| Demographics | Rating | Rank | Disability |
| Immigrants | Lithuania | 99.8 /100 | #56 | Exceptional 10.9% |
| Salvadorans | 99.8 /100 | #57 | Exceptional 10.9% |
| Immigrants | South America | 99.8 /100 | #58 | Exceptional 10.9% |
| Immigrants | Colombia | 99.7 /100 | #59 | Exceptional 10.9% |
| Zimbabweans | 99.7 /100 | #60 | Exceptional 10.9% |
| Immigrants | Bulgaria | 99.7 /100 | #61 | Exceptional 10.9% |
| Immigrants | Northern Africa | 99.7 /100 | #62 | Exceptional 10.9% |
| Immigrants | Eritrea | 99.7 /100 | #63 | Exceptional 11.0% |
| Immigrants | Sweden | 99.6 /100 | #64 | Exceptional 11.0% |
| Bulgarians | 99.6 /100 | #65 | Exceptional 11.0% |
| Laotians | 99.6 /100 | #66 | Exceptional 11.0% |
| Colombians | 99.6 /100 | #67 | Exceptional 11.0% |
| Immigrants | Afghanistan | 99.6 /100 | #68 | Exceptional 11.0% |
| Sri Lankans | 99.5 /100 | #69 | Exceptional 11.0% |
| Immigrants | France | 99.4 /100 | #70 | Exceptional 11.0% |
| Immigrants | Lebanon | 99.4 /100 | #71 | Exceptional 11.0% |
| Immigrants | Chile | 99.4 /100 | #72 | Exceptional 11.0% |
| Immigrants | Bangladesh | 99.4 /100 | #73 | Exceptional 11.0% |
| Immigrants | Serbia | 99.4 /100 | #74 | Exceptional 11.0% |
| Immigrants | Vietnam | 99.4 /100 | #75 | Exceptional 11.0% |
| Sierra Leoneans | 99.3 /100 | #76 | Exceptional 11.0% |