Immigrants from Lithuania vs Immigrants from Japan Disability
COMPARE
Immigrants from Lithuania
Immigrants from Japan
Disability
Disability Comparison
Immigrants from Lithuania
Immigrants from Japan
10.9%
DISABILITY
99.8/ 100
METRIC RATING
56th/ 347
METRIC RANK
10.8%
DISABILITY
99.9/ 100
METRIC RATING
44th/ 347
METRIC RANK
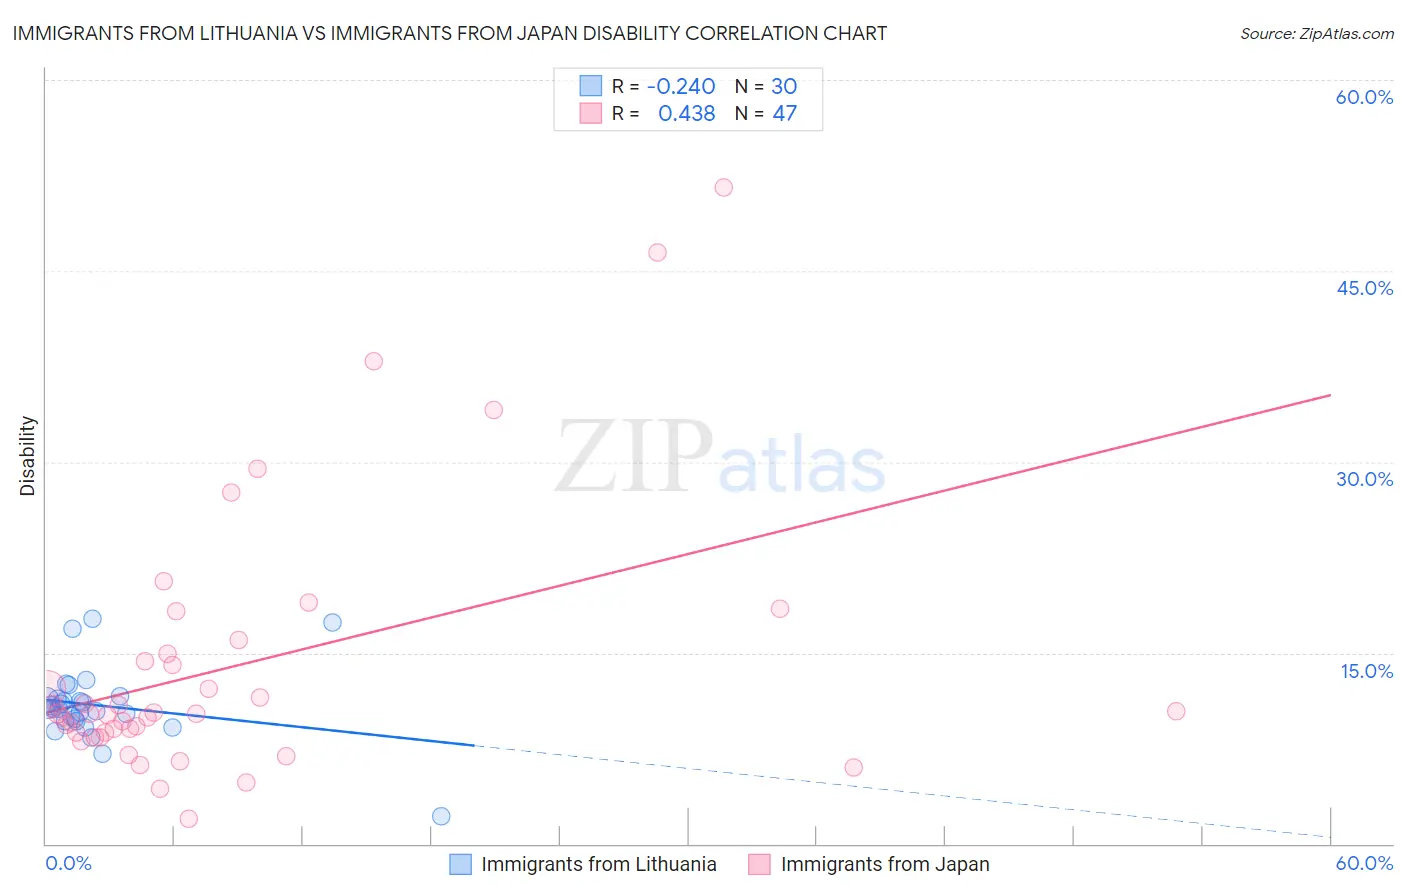
Immigrants from Lithuania vs Immigrants from Japan Disability Correlation Chart
The statistical analysis conducted on geographies consisting of 117,724,932 people shows a weak negative correlation between the proportion of Immigrants from Lithuania and percentage of population with a disability in the United States with a correlation coefficient (R) of -0.240 and weighted average of 10.9%. Similarly, the statistical analysis conducted on geographies consisting of 340,149,948 people shows a moderate positive correlation between the proportion of Immigrants from Japan and percentage of population with a disability in the United States with a correlation coefficient (R) of 0.438 and weighted average of 10.8%, a difference of 0.84%.
Disability Correlation Summary
| Measurement | Immigrants from Lithuania | Immigrants from Japan |
| Minimum | 2.1% | 2.0% |
| Maximum | 17.7% | 51.5% |
| Range | 15.5% | 49.5% |
| Mean | 10.9% | 13.9% |
| Median | 10.6% | 10.2% |
| Interquartile 25% (IQ1) | 9.6% | 8.7% |
| Interquartile 75% (IQ3) | 11.4% | 14.9% |
| Interquartile Range (IQR) | 1.7% | 6.2% |
| Standard Deviation (Sample) | 2.9% | 10.5% |
| Standard Deviation (Population) | 2.9% | 10.3% |
Demographics Similar to Immigrants from Lithuania and Immigrants from Japan by Disability
In terms of disability, the demographic groups most similar to Immigrants from Lithuania are Immigrants from El Salvador (10.9%, a difference of 0.11%), Immigrants from Spain (10.9%, a difference of 0.20%), Jordanian (10.9%, a difference of 0.20%), South American (10.9%, a difference of 0.22%), and Salvadoran (10.9%, a difference of 0.24%). Similarly, the demographic groups most similar to Immigrants from Japan are Israeli (10.8%, a difference of 0.10%), Immigrants from Nepal (10.8%, a difference of 0.15%), Immigrants from Australia (10.8%, a difference of 0.25%), Mongolian (10.8%, a difference of 0.29%), and Immigrants from Peru (10.8%, a difference of 0.29%).
| Demographics | Rating | Rank | Disability |
| Mongolians | 99.9 /100 | #40 | Exceptional 10.8% |
| Immigrants | Australia | 99.9 /100 | #41 | Exceptional 10.8% |
| Immigrants | Nepal | 99.9 /100 | #42 | Exceptional 10.8% |
| Israelis | 99.9 /100 | #43 | Exceptional 10.8% |
| Immigrants | Japan | 99.9 /100 | #44 | Exceptional 10.8% |
| Immigrants | Peru | 99.9 /100 | #45 | Exceptional 10.8% |
| Tongans | 99.9 /100 | #46 | Exceptional 10.8% |
| Taiwanese | 99.9 /100 | #47 | Exceptional 10.8% |
| Soviet Union | 99.9 /100 | #48 | Exceptional 10.9% |
| Vietnamese | 99.9 /100 | #49 | Exceptional 10.9% |
| Immigrants | Saudi Arabia | 99.9 /100 | #50 | Exceptional 10.9% |
| Peruvians | 99.8 /100 | #51 | Exceptional 10.9% |
| South Americans | 99.8 /100 | #52 | Exceptional 10.9% |
| Immigrants | Spain | 99.8 /100 | #53 | Exceptional 10.9% |
| Jordanians | 99.8 /100 | #54 | Exceptional 10.9% |
| Immigrants | El Salvador | 99.8 /100 | #55 | Exceptional 10.9% |
| Immigrants | Lithuania | 99.8 /100 | #56 | Exceptional 10.9% |
| Salvadorans | 99.8 /100 | #57 | Exceptional 10.9% |
| Immigrants | South America | 99.8 /100 | #58 | Exceptional 10.9% |
| Immigrants | Colombia | 99.7 /100 | #59 | Exceptional 10.9% |
| Zimbabweans | 99.7 /100 | #60 | Exceptional 10.9% |