Immigrants from Lithuania vs Immigrants from Laos Disability
COMPARE
Immigrants from Lithuania
Immigrants from Laos
Disability
Disability Comparison
Immigrants from Lithuania
Immigrants from Laos
10.9%
DISABILITY
99.8/ 100
METRIC RATING
56th/ 347
METRIC RANK
12.4%
DISABILITY
0.5/ 100
METRIC RATING
257th/ 347
METRIC RANK
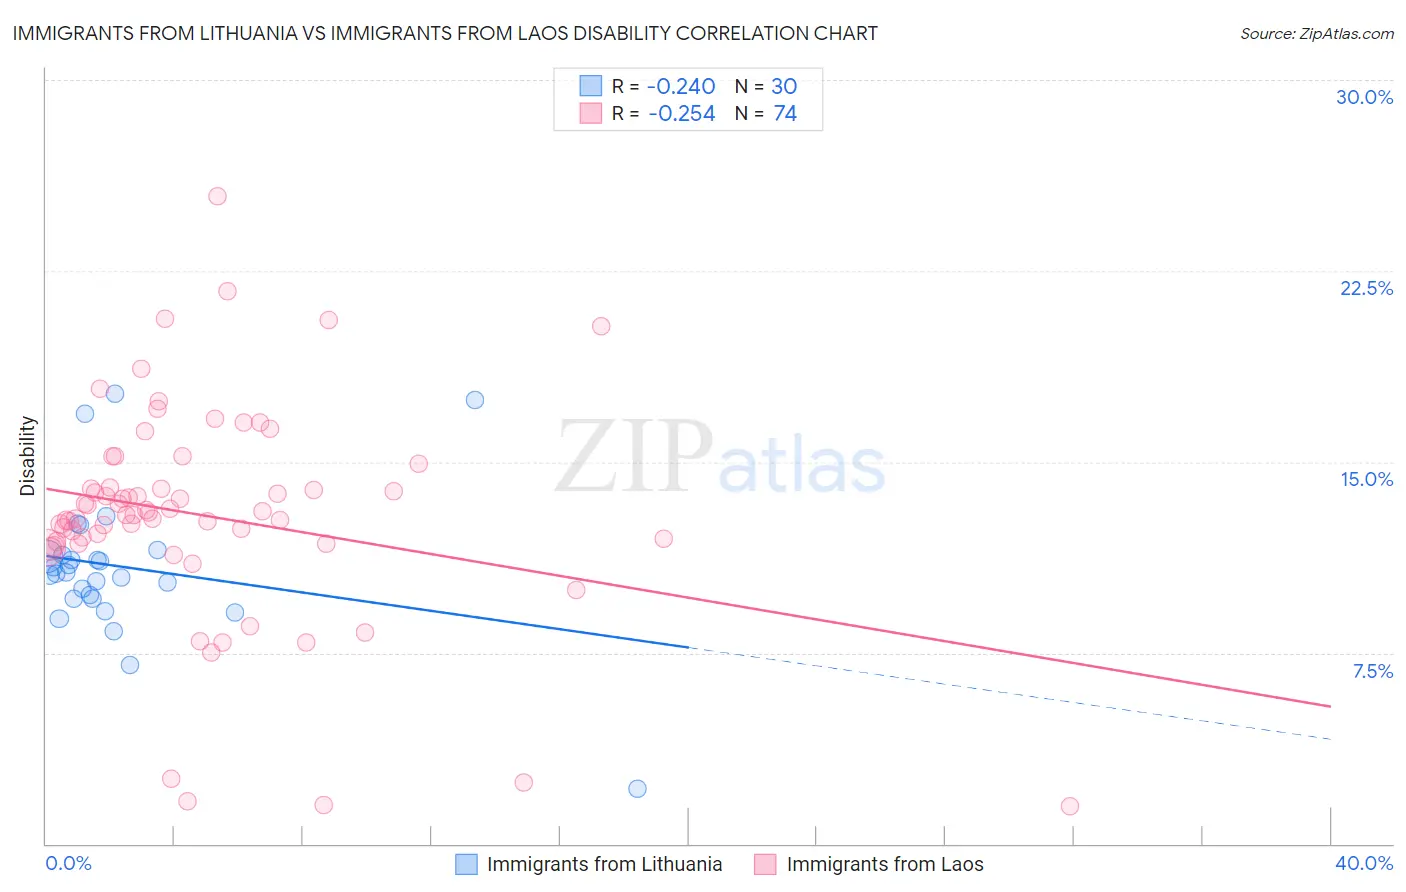
Immigrants from Lithuania vs Immigrants from Laos Disability Correlation Chart
The statistical analysis conducted on geographies consisting of 117,724,932 people shows a weak negative correlation between the proportion of Immigrants from Lithuania and percentage of population with a disability in the United States with a correlation coefficient (R) of -0.240 and weighted average of 10.9%. Similarly, the statistical analysis conducted on geographies consisting of 201,466,628 people shows a weak negative correlation between the proportion of Immigrants from Laos and percentage of population with a disability in the United States with a correlation coefficient (R) of -0.254 and weighted average of 12.4%, a difference of 13.7%.
Disability Correlation Summary
| Measurement | Immigrants from Lithuania | Immigrants from Laos |
| Minimum | 2.1% | 1.4% |
| Maximum | 17.7% | 25.4% |
| Range | 15.5% | 24.0% |
| Mean | 10.9% | 12.9% |
| Median | 10.6% | 13.0% |
| Interquartile 25% (IQ1) | 9.6% | 11.8% |
| Interquartile 75% (IQ3) | 11.4% | 14.0% |
| Interquartile Range (IQR) | 1.7% | 2.2% |
| Standard Deviation (Sample) | 2.9% | 4.3% |
| Standard Deviation (Population) | 2.9% | 4.3% |
Similar Demographics by Disability
Demographics Similar to Immigrants from Lithuania by Disability
In terms of disability, the demographic groups most similar to Immigrants from Lithuania are Immigrants from El Salvador (10.9%, a difference of 0.11%), Immigrants from Spain (10.9%, a difference of 0.20%), Jordanian (10.9%, a difference of 0.20%), South American (10.9%, a difference of 0.22%), and Salvadoran (10.9%, a difference of 0.24%).
| Demographics | Rating | Rank | Disability |
| Vietnamese | 99.9 /100 | #49 | Exceptional 10.9% |
| Immigrants | Saudi Arabia | 99.9 /100 | #50 | Exceptional 10.9% |
| Peruvians | 99.8 /100 | #51 | Exceptional 10.9% |
| South Americans | 99.8 /100 | #52 | Exceptional 10.9% |
| Immigrants | Spain | 99.8 /100 | #53 | Exceptional 10.9% |
| Jordanians | 99.8 /100 | #54 | Exceptional 10.9% |
| Immigrants | El Salvador | 99.8 /100 | #55 | Exceptional 10.9% |
| Immigrants | Lithuania | 99.8 /100 | #56 | Exceptional 10.9% |
| Salvadorans | 99.8 /100 | #57 | Exceptional 10.9% |
| Immigrants | South America | 99.8 /100 | #58 | Exceptional 10.9% |
| Immigrants | Colombia | 99.7 /100 | #59 | Exceptional 10.9% |
| Zimbabweans | 99.7 /100 | #60 | Exceptional 10.9% |
| Immigrants | Bulgaria | 99.7 /100 | #61 | Exceptional 10.9% |
| Immigrants | Northern Africa | 99.7 /100 | #62 | Exceptional 10.9% |
| Immigrants | Eritrea | 99.7 /100 | #63 | Exceptional 11.0% |
Demographics Similar to Immigrants from Laos by Disability
In terms of disability, the demographic groups most similar to Immigrants from Laos are Immigrants from Dominica (12.4%, a difference of 0.090%), Slavic (12.4%, a difference of 0.14%), Slovene (12.4%, a difference of 0.16%), Canadian (12.4%, a difference of 0.20%), and Immigrants from Liberia (12.4%, a difference of 0.23%).
| Demographics | Rating | Rank | Disability |
| Sub-Saharan Africans | 1.4 /100 | #250 | Tragic 12.3% |
| Europeans | 1.4 /100 | #251 | Tragic 12.3% |
| Bermudans | 1.1 /100 | #252 | Tragic 12.3% |
| Belgians | 0.8 /100 | #253 | Tragic 12.3% |
| German Russians | 0.8 /100 | #254 | Tragic 12.3% |
| Slovenes | 0.6 /100 | #255 | Tragic 12.4% |
| Immigrants | Dominica | 0.6 /100 | #256 | Tragic 12.4% |
| Immigrants | Laos | 0.5 /100 | #257 | Tragic 12.4% |
| Slavs | 0.5 /100 | #258 | Tragic 12.4% |
| Canadians | 0.4 /100 | #259 | Tragic 12.4% |
| Immigrants | Liberia | 0.4 /100 | #260 | Tragic 12.4% |
| Scandinavians | 0.4 /100 | #261 | Tragic 12.4% |
| Native Hawaiians | 0.3 /100 | #262 | Tragic 12.5% |
| Hawaiians | 0.2 /100 | #263 | Tragic 12.5% |
| Immigrants | Germany | 0.2 /100 | #264 | Tragic 12.5% |