Immigrants from Lithuania vs Colville Ambulatory Disability
COMPARE
Immigrants from Lithuania
Colville
Ambulatory Disability
Ambulatory Disability Comparison
Immigrants from Lithuania
Colville
5.6%
AMBULATORY DISABILITY
99.8/ 100
METRIC RATING
60th/ 347
METRIC RANK
8.2%
AMBULATORY DISABILITY
0.0/ 100
METRIC RATING
338th/ 347
METRIC RANK
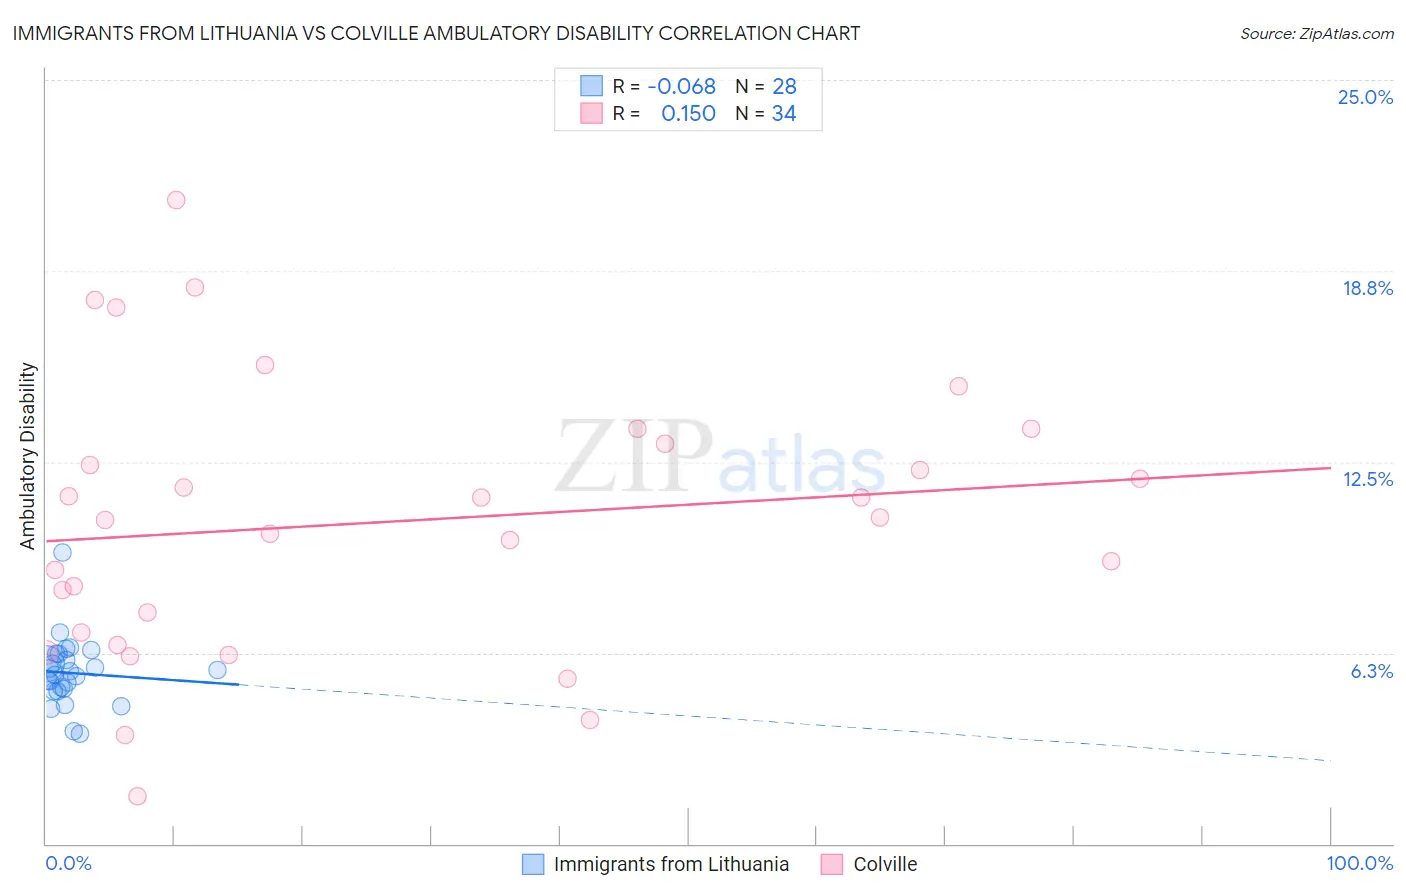
Immigrants from Lithuania vs Colville Ambulatory Disability Correlation Chart
The statistical analysis conducted on geographies consisting of 117,713,012 people shows a slight negative correlation between the proportion of Immigrants from Lithuania and percentage of population with ambulatory disability in the United States with a correlation coefficient (R) of -0.068 and weighted average of 5.6%. Similarly, the statistical analysis conducted on geographies consisting of 34,678,194 people shows a poor positive correlation between the proportion of Colville and percentage of population with ambulatory disability in the United States with a correlation coefficient (R) of 0.150 and weighted average of 8.2%, a difference of 45.9%.
Ambulatory Disability Correlation Summary
| Measurement | Immigrants from Lithuania | Colville |
| Minimum | 3.6% | 1.6% |
| Maximum | 9.5% | 21.1% |
| Range | 5.9% | 19.5% |
| Mean | 5.6% | 10.5% |
| Median | 5.6% | 10.6% |
| Interquartile 25% (IQ1) | 5.0% | 6.9% |
| Interquartile 75% (IQ3) | 6.1% | 13.1% |
| Interquartile Range (IQR) | 1.1% | 6.2% |
| Standard Deviation (Sample) | 1.1% | 4.5% |
| Standard Deviation (Population) | 1.1% | 4.4% |
Similar Demographics by Ambulatory Disability
Demographics Similar to Immigrants from Lithuania by Ambulatory Disability
In terms of ambulatory disability, the demographic groups most similar to Immigrants from Lithuania are Immigrants from Afghanistan (5.6%, a difference of 0.040%), Immigrants from Zimbabwe (5.6%, a difference of 0.080%), Immigrants from Belgium (5.6%, a difference of 0.12%), Immigrants from Spain (5.6%, a difference of 0.13%), and Immigrants from Brazil (5.6%, a difference of 0.14%).
| Demographics | Rating | Rank | Ambulatory Disability |
| Immigrants | Egypt | 99.8 /100 | #53 | Exceptional 5.6% |
| Immigrants | Eastern Africa | 99.8 /100 | #54 | Exceptional 5.6% |
| Immigrants | Bulgaria | 99.8 /100 | #55 | Exceptional 5.6% |
| Inupiat | 99.8 /100 | #56 | Exceptional 5.6% |
| Immigrants | Brazil | 99.8 /100 | #57 | Exceptional 5.6% |
| Immigrants | Zimbabwe | 99.8 /100 | #58 | Exceptional 5.6% |
| Immigrants | Afghanistan | 99.8 /100 | #59 | Exceptional 5.6% |
| Immigrants | Lithuania | 99.8 /100 | #60 | Exceptional 5.6% |
| Immigrants | Belgium | 99.7 /100 | #61 | Exceptional 5.6% |
| Immigrants | Spain | 99.7 /100 | #62 | Exceptional 5.6% |
| Immigrants | France | 99.7 /100 | #63 | Exceptional 5.6% |
| Laotians | 99.7 /100 | #64 | Exceptional 5.7% |
| Immigrants | Switzerland | 99.7 /100 | #65 | Exceptional 5.7% |
| Israelis | 99.6 /100 | #66 | Exceptional 5.7% |
| Immigrants | Uganda | 99.6 /100 | #67 | Exceptional 5.7% |
Demographics Similar to Colville by Ambulatory Disability
In terms of ambulatory disability, the demographic groups most similar to Colville are Pima (8.2%, a difference of 0.35%), Dutch West Indian (8.2%, a difference of 0.57%), Choctaw (8.3%, a difference of 1.2%), Seminole (8.0%, a difference of 2.2%), and Chickasaw (8.0%, a difference of 2.3%).
| Demographics | Rating | Rank | Ambulatory Disability |
| Cajuns | 0.0 /100 | #331 | Tragic 7.8% |
| Menominee | 0.0 /100 | #332 | Tragic 7.8% |
| Cherokee | 0.0 /100 | #333 | Tragic 7.9% |
| Yuman | 0.0 /100 | #334 | Tragic 7.9% |
| Chickasaw | 0.0 /100 | #335 | Tragic 8.0% |
| Seminole | 0.0 /100 | #336 | Tragic 8.0% |
| Dutch West Indians | 0.0 /100 | #337 | Tragic 8.2% |
| Colville | 0.0 /100 | #338 | Tragic 8.2% |
| Pima | 0.0 /100 | #339 | Tragic 8.2% |
| Choctaw | 0.0 /100 | #340 | Tragic 8.3% |
| Creek | 0.0 /100 | #341 | Tragic 8.5% |
| Kiowa | 0.0 /100 | #342 | Tragic 8.6% |
| Tohono O'odham | 0.0 /100 | #343 | Tragic 8.7% |
| Tsimshian | 0.0 /100 | #344 | Tragic 8.8% |
| Puerto Ricans | 0.0 /100 | #345 | Tragic 8.9% |