Immigrants from Lithuania vs Immigrants from Vietnam Ambulatory Disability
COMPARE
Immigrants from Lithuania
Immigrants from Vietnam
Ambulatory Disability
Ambulatory Disability Comparison
Immigrants from Lithuania
Immigrants from Vietnam
5.6%
AMBULATORY DISABILITY
99.8/ 100
METRIC RATING
60th/ 347
METRIC RANK
5.7%
AMBULATORY DISABILITY
99.3/ 100
METRIC RATING
77th/ 347
METRIC RANK
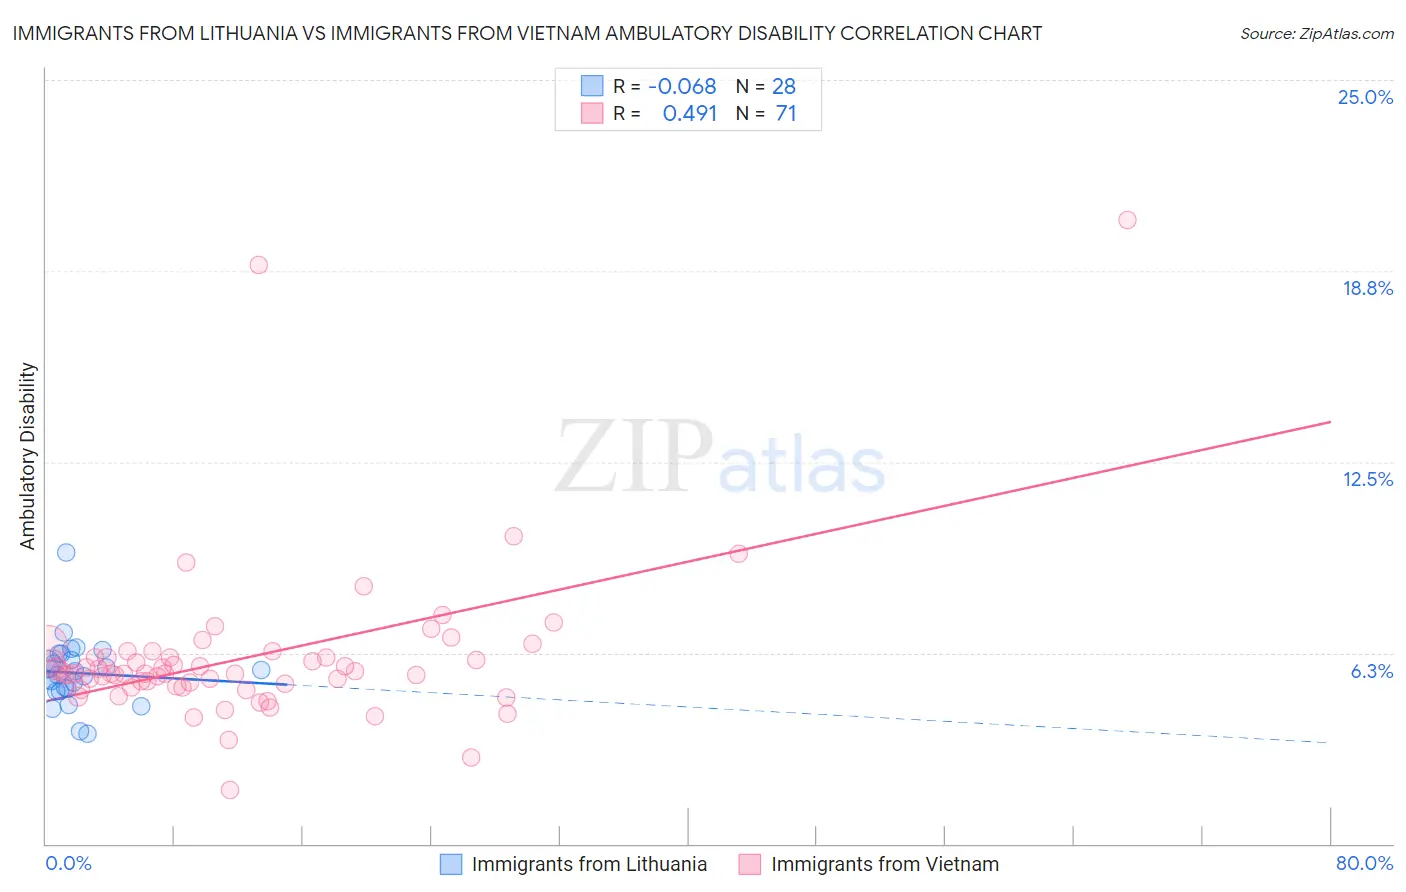
Immigrants from Lithuania vs Immigrants from Vietnam Ambulatory Disability Correlation Chart
The statistical analysis conducted on geographies consisting of 117,713,012 people shows a slight negative correlation between the proportion of Immigrants from Lithuania and percentage of population with ambulatory disability in the United States with a correlation coefficient (R) of -0.068 and weighted average of 5.6%. Similarly, the statistical analysis conducted on geographies consisting of 404,718,209 people shows a moderate positive correlation between the proportion of Immigrants from Vietnam and percentage of population with ambulatory disability in the United States with a correlation coefficient (R) of 0.491 and weighted average of 5.7%, a difference of 1.6%.
Ambulatory Disability Correlation Summary
| Measurement | Immigrants from Lithuania | Immigrants from Vietnam |
| Minimum | 3.6% | 1.8% |
| Maximum | 9.5% | 20.4% |
| Range | 5.9% | 18.7% |
| Mean | 5.6% | 6.1% |
| Median | 5.6% | 5.6% |
| Interquartile 25% (IQ1) | 5.0% | 5.2% |
| Interquartile 75% (IQ3) | 6.1% | 6.1% |
| Interquartile Range (IQR) | 1.1% | 0.95% |
| Standard Deviation (Sample) | 1.1% | 2.7% |
| Standard Deviation (Population) | 1.1% | 2.6% |
Demographics Similar to Immigrants from Lithuania and Immigrants from Vietnam by Ambulatory Disability
In terms of ambulatory disability, the demographic groups most similar to Immigrants from Lithuania are Immigrants from Afghanistan (5.6%, a difference of 0.040%), Immigrants from Zimbabwe (5.6%, a difference of 0.080%), Immigrants from Belgium (5.6%, a difference of 0.12%), Immigrants from Spain (5.6%, a difference of 0.13%), and Immigrants from France (5.6%, a difference of 0.26%). Similarly, the demographic groups most similar to Immigrants from Vietnam are Somali (5.7%, a difference of 0.010%), Sudanese (5.7%, a difference of 0.17%), Immigrants from South Africa (5.7%, a difference of 0.20%), Immigrants from Northern Africa (5.7%, a difference of 0.25%), and Immigrants from Cameroon (5.7%, a difference of 0.25%).
| Demographics | Rating | Rank | Ambulatory Disability |
| Immigrants | Zimbabwe | 99.8 /100 | #58 | Exceptional 5.6% |
| Immigrants | Afghanistan | 99.8 /100 | #59 | Exceptional 5.6% |
| Immigrants | Lithuania | 99.8 /100 | #60 | Exceptional 5.6% |
| Immigrants | Belgium | 99.7 /100 | #61 | Exceptional 5.6% |
| Immigrants | Spain | 99.7 /100 | #62 | Exceptional 5.6% |
| Immigrants | France | 99.7 /100 | #63 | Exceptional 5.6% |
| Laotians | 99.7 /100 | #64 | Exceptional 5.7% |
| Immigrants | Switzerland | 99.7 /100 | #65 | Exceptional 5.7% |
| Israelis | 99.6 /100 | #66 | Exceptional 5.7% |
| Immigrants | Uganda | 99.6 /100 | #67 | Exceptional 5.7% |
| Sri Lankans | 99.6 /100 | #68 | Exceptional 5.7% |
| Peruvians | 99.5 /100 | #69 | Exceptional 5.7% |
| Sierra Leoneans | 99.4 /100 | #70 | Exceptional 5.7% |
| Immigrants | Peru | 99.4 /100 | #71 | Exceptional 5.7% |
| Brazilians | 99.4 /100 | #72 | Exceptional 5.7% |
| Immigrants | Northern Africa | 99.4 /100 | #73 | Exceptional 5.7% |
| Immigrants | Cameroon | 99.4 /100 | #74 | Exceptional 5.7% |
| Immigrants | South Africa | 99.3 /100 | #75 | Exceptional 5.7% |
| Sudanese | 99.3 /100 | #76 | Exceptional 5.7% |
| Immigrants | Vietnam | 99.3 /100 | #77 | Exceptional 5.7% |
| Somalis | 99.2 /100 | #78 | Exceptional 5.7% |