Immigrants from Lithuania vs Egyptian Ambulatory Disability
COMPARE
Immigrants from Lithuania
Egyptian
Ambulatory Disability
Ambulatory Disability Comparison
Immigrants from Lithuania
Egyptians
5.6%
AMBULATORY DISABILITY
99.8/ 100
METRIC RATING
60th/ 347
METRIC RANK
5.6%
AMBULATORY DISABILITY
99.9/ 100
METRIC RATING
46th/ 347
METRIC RANK
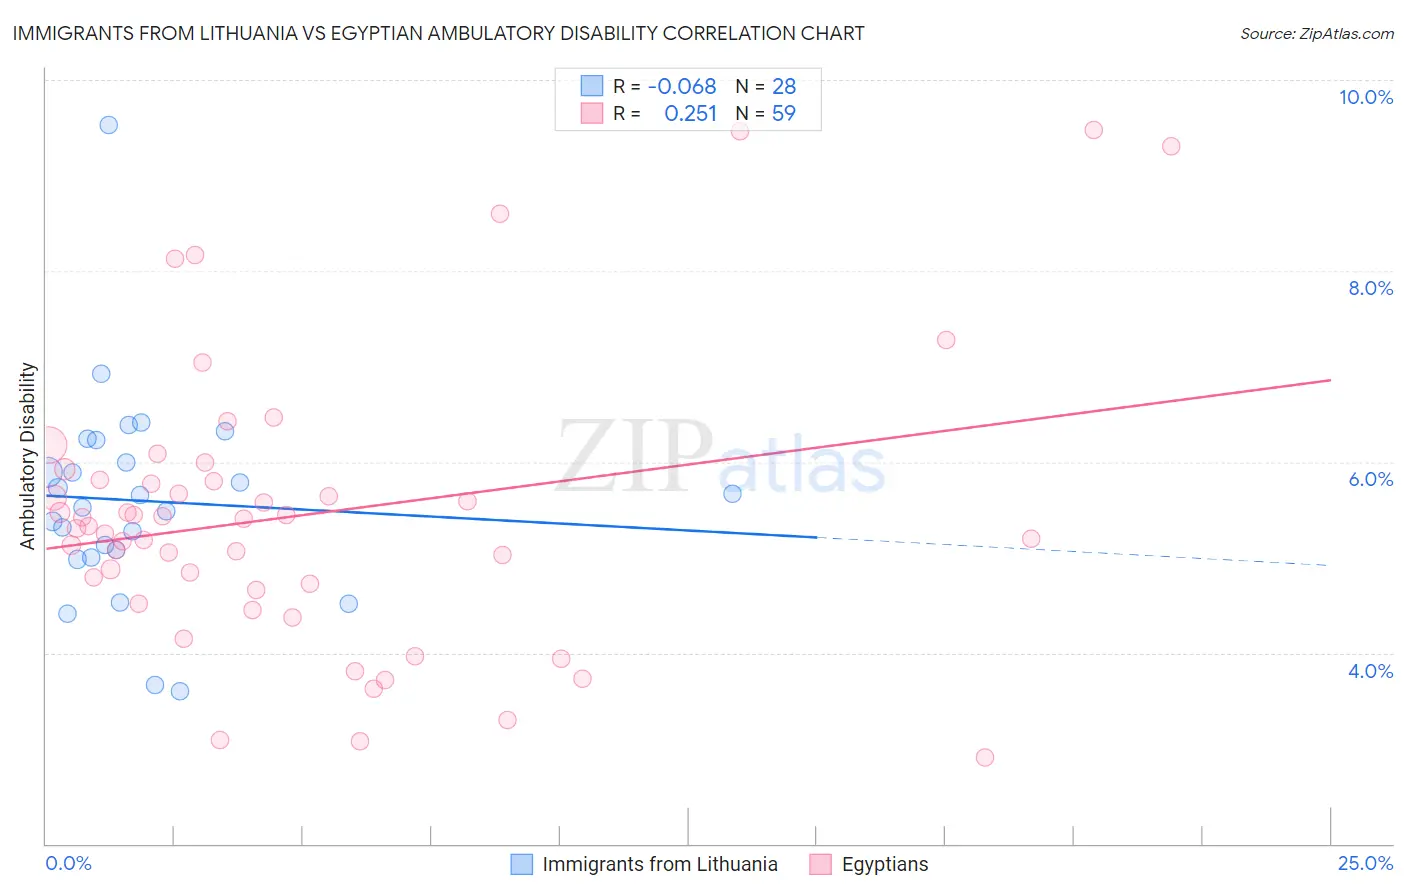
Immigrants from Lithuania vs Egyptian Ambulatory Disability Correlation Chart
The statistical analysis conducted on geographies consisting of 117,713,012 people shows a slight negative correlation between the proportion of Immigrants from Lithuania and percentage of population with ambulatory disability in the United States with a correlation coefficient (R) of -0.068 and weighted average of 5.6%. Similarly, the statistical analysis conducted on geographies consisting of 276,859,552 people shows a weak positive correlation between the proportion of Egyptians and percentage of population with ambulatory disability in the United States with a correlation coefficient (R) of 0.251 and weighted average of 5.6%, a difference of 1.3%.
Ambulatory Disability Correlation Summary
| Measurement | Immigrants from Lithuania | Egyptian |
| Minimum | 3.6% | 2.9% |
| Maximum | 9.5% | 9.5% |
| Range | 5.9% | 6.6% |
| Mean | 5.6% | 5.4% |
| Median | 5.6% | 5.3% |
| Interquartile 25% (IQ1) | 5.0% | 4.7% |
| Interquartile 75% (IQ3) | 6.1% | 5.8% |
| Interquartile Range (IQR) | 1.1% | 1.2% |
| Standard Deviation (Sample) | 1.1% | 1.5% |
| Standard Deviation (Population) | 1.1% | 1.5% |
Demographics Similar to Immigrants from Lithuania and Egyptians by Ambulatory Disability
In terms of ambulatory disability, the demographic groups most similar to Immigrants from Lithuania are Immigrants from Afghanistan (5.6%, a difference of 0.040%), Immigrants from Zimbabwe (5.6%, a difference of 0.080%), Immigrants from Belgium (5.6%, a difference of 0.12%), Immigrants from Spain (5.6%, a difference of 0.13%), and Immigrants from Brazil (5.6%, a difference of 0.14%). Similarly, the demographic groups most similar to Egyptians are Immigrants from Japan (5.6%, a difference of 0.0%), Immigrants from Sweden (5.6%, a difference of 0.010%), Immigrants from Argentina (5.6%, a difference of 0.020%), Immigrants from Indonesia (5.5%, a difference of 0.18%), and Bulgarian (5.6%, a difference of 0.21%).
| Demographics | Rating | Rank | Ambulatory Disability |
| Paraguayans | 99.9 /100 | #43 | Exceptional 5.5% |
| Immigrants | Indonesia | 99.9 /100 | #44 | Exceptional 5.5% |
| Immigrants | Sweden | 99.9 /100 | #45 | Exceptional 5.6% |
| Egyptians | 99.9 /100 | #46 | Exceptional 5.6% |
| Immigrants | Japan | 99.9 /100 | #47 | Exceptional 5.6% |
| Immigrants | Argentina | 99.9 /100 | #48 | Exceptional 5.6% |
| Bulgarians | 99.9 /100 | #49 | Exceptional 5.6% |
| Luxembourgers | 99.9 /100 | #50 | Exceptional 5.6% |
| Taiwanese | 99.8 /100 | #51 | Exceptional 5.6% |
| Jordanians | 99.8 /100 | #52 | Exceptional 5.6% |
| Immigrants | Egypt | 99.8 /100 | #53 | Exceptional 5.6% |
| Immigrants | Eastern Africa | 99.8 /100 | #54 | Exceptional 5.6% |
| Immigrants | Bulgaria | 99.8 /100 | #55 | Exceptional 5.6% |
| Inupiat | 99.8 /100 | #56 | Exceptional 5.6% |
| Immigrants | Brazil | 99.8 /100 | #57 | Exceptional 5.6% |
| Immigrants | Zimbabwe | 99.8 /100 | #58 | Exceptional 5.6% |
| Immigrants | Afghanistan | 99.8 /100 | #59 | Exceptional 5.6% |
| Immigrants | Lithuania | 99.8 /100 | #60 | Exceptional 5.6% |
| Immigrants | Belgium | 99.7 /100 | #61 | Exceptional 5.6% |
| Immigrants | Spain | 99.7 /100 | #62 | Exceptional 5.6% |
| Immigrants | France | 99.7 /100 | #63 | Exceptional 5.6% |