Immigrants from Lithuania vs Spanish Ambulatory Disability
COMPARE
Immigrants from Lithuania
Spanish
Ambulatory Disability
Ambulatory Disability Comparison
Immigrants from Lithuania
Spanish
5.6%
AMBULATORY DISABILITY
99.8/ 100
METRIC RATING
60th/ 347
METRIC RANK
6.6%
AMBULATORY DISABILITY
0.2/ 100
METRIC RATING
268th/ 347
METRIC RANK
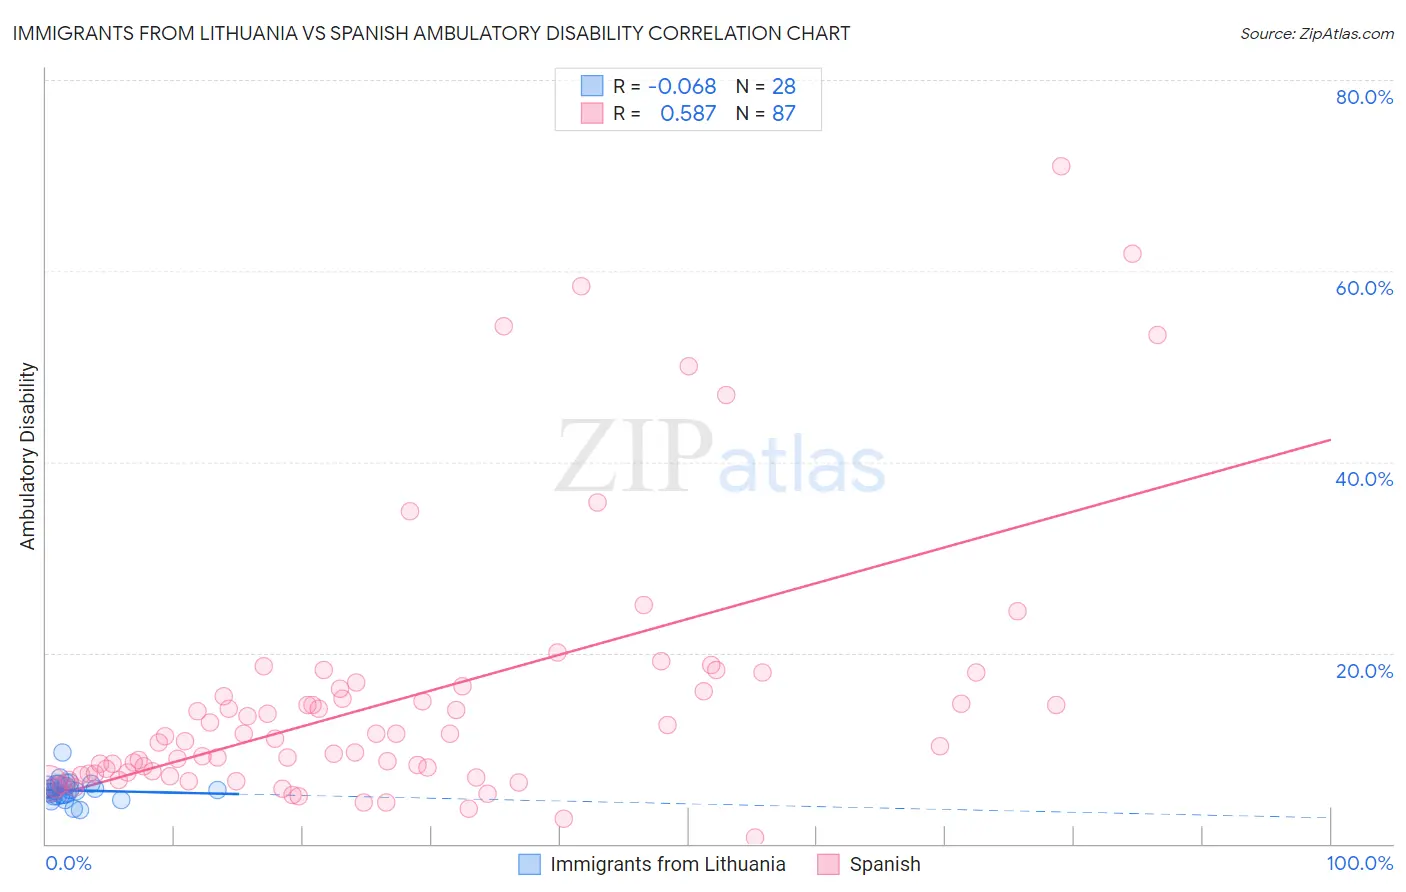
Immigrants from Lithuania vs Spanish Ambulatory Disability Correlation Chart
The statistical analysis conducted on geographies consisting of 117,713,012 people shows a slight negative correlation between the proportion of Immigrants from Lithuania and percentage of population with ambulatory disability in the United States with a correlation coefficient (R) of -0.068 and weighted average of 5.6%. Similarly, the statistical analysis conducted on geographies consisting of 421,992,199 people shows a substantial positive correlation between the proportion of Spanish and percentage of population with ambulatory disability in the United States with a correlation coefficient (R) of 0.587 and weighted average of 6.6%, a difference of 17.7%.
Ambulatory Disability Correlation Summary
| Measurement | Immigrants from Lithuania | Spanish |
| Minimum | 3.6% | 0.68% |
| Maximum | 9.5% | 71.0% |
| Range | 5.9% | 70.3% |
| Mean | 5.6% | 15.1% |
| Median | 5.6% | 11.0% |
| Interquartile 25% (IQ1) | 5.0% | 7.3% |
| Interquartile 75% (IQ3) | 6.1% | 16.2% |
| Interquartile Range (IQR) | 1.1% | 8.9% |
| Standard Deviation (Sample) | 1.1% | 13.9% |
| Standard Deviation (Population) | 1.1% | 13.8% |
Similar Demographics by Ambulatory Disability
Demographics Similar to Immigrants from Lithuania by Ambulatory Disability
In terms of ambulatory disability, the demographic groups most similar to Immigrants from Lithuania are Immigrants from Afghanistan (5.6%, a difference of 0.040%), Immigrants from Zimbabwe (5.6%, a difference of 0.080%), Immigrants from Belgium (5.6%, a difference of 0.12%), Immigrants from Spain (5.6%, a difference of 0.13%), and Immigrants from Brazil (5.6%, a difference of 0.14%).
| Demographics | Rating | Rank | Ambulatory Disability |
| Immigrants | Egypt | 99.8 /100 | #53 | Exceptional 5.6% |
| Immigrants | Eastern Africa | 99.8 /100 | #54 | Exceptional 5.6% |
| Immigrants | Bulgaria | 99.8 /100 | #55 | Exceptional 5.6% |
| Inupiat | 99.8 /100 | #56 | Exceptional 5.6% |
| Immigrants | Brazil | 99.8 /100 | #57 | Exceptional 5.6% |
| Immigrants | Zimbabwe | 99.8 /100 | #58 | Exceptional 5.6% |
| Immigrants | Afghanistan | 99.8 /100 | #59 | Exceptional 5.6% |
| Immigrants | Lithuania | 99.8 /100 | #60 | Exceptional 5.6% |
| Immigrants | Belgium | 99.7 /100 | #61 | Exceptional 5.6% |
| Immigrants | Spain | 99.7 /100 | #62 | Exceptional 5.6% |
| Immigrants | France | 99.7 /100 | #63 | Exceptional 5.6% |
| Laotians | 99.7 /100 | #64 | Exceptional 5.7% |
| Immigrants | Switzerland | 99.7 /100 | #65 | Exceptional 5.7% |
| Israelis | 99.6 /100 | #66 | Exceptional 5.7% |
| Immigrants | Uganda | 99.6 /100 | #67 | Exceptional 5.7% |
Demographics Similar to Spanish by Ambulatory Disability
In terms of ambulatory disability, the demographic groups most similar to Spanish are Trinidadian and Tobagonian (6.6%, a difference of 0.020%), Guyanese (6.6%, a difference of 0.14%), Bahamian (6.6%, a difference of 0.26%), French (6.6%, a difference of 0.31%), and Nepalese (6.6%, a difference of 0.33%).
| Demographics | Rating | Rank | Ambulatory Disability |
| Irish | 0.4 /100 | #261 | Tragic 6.6% |
| English | 0.4 /100 | #262 | Tragic 6.6% |
| Hmong | 0.3 /100 | #263 | Tragic 6.6% |
| Nepalese | 0.2 /100 | #264 | Tragic 6.6% |
| Bahamians | 0.2 /100 | #265 | Tragic 6.6% |
| Guyanese | 0.2 /100 | #266 | Tragic 6.6% |
| Trinidadians and Tobagonians | 0.2 /100 | #267 | Tragic 6.6% |
| Spanish | 0.2 /100 | #268 | Tragic 6.6% |
| French | 0.1 /100 | #269 | Tragic 6.6% |
| Slovaks | 0.1 /100 | #270 | Tragic 6.7% |
| Immigrants | Trinidad and Tobago | 0.1 /100 | #271 | Tragic 6.7% |
| French Canadians | 0.1 /100 | #272 | Tragic 6.7% |
| Whites/Caucasians | 0.1 /100 | #273 | Tragic 6.7% |
| Sioux | 0.1 /100 | #274 | Tragic 6.7% |
| Immigrants | Guyana | 0.1 /100 | #275 | Tragic 6.7% |