Immigrants from Latvia vs Immigrants from Switzerland Hearing Disability
COMPARE
Immigrants from Latvia
Immigrants from Switzerland
Hearing Disability
Hearing Disability Comparison
Immigrants from Latvia
Immigrants from Switzerland
3.1%
HEARING DISABILITY
12.7/ 100
METRIC RATING
208th/ 347
METRIC RANK
3.1%
HEARING DISABILITY
28.8/ 100
METRIC RATING
191st/ 347
METRIC RANK
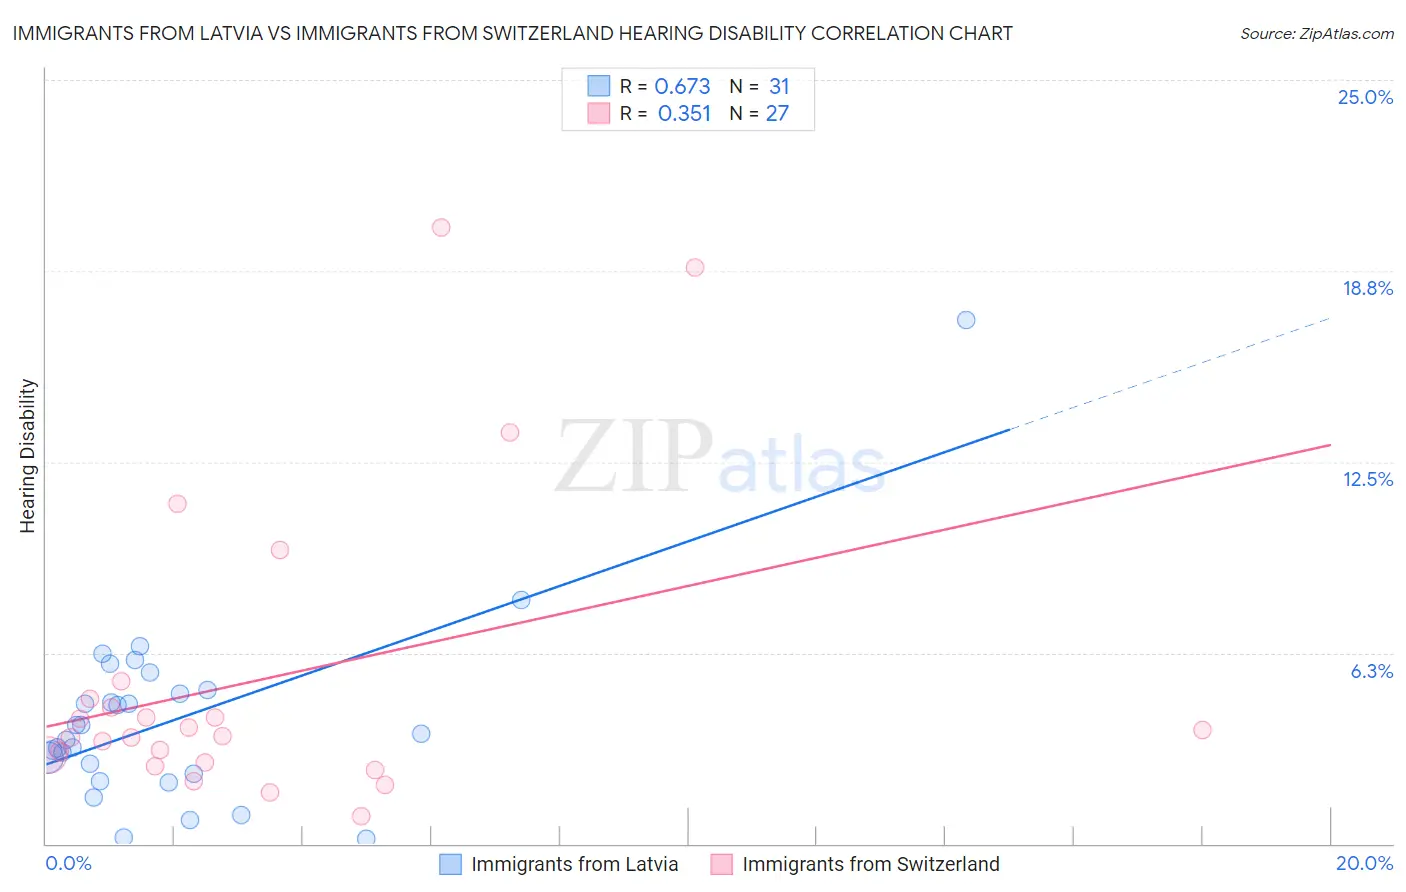
Immigrants from Latvia vs Immigrants from Switzerland Hearing Disability Correlation Chart
The statistical analysis conducted on geographies consisting of 113,736,493 people shows a significant positive correlation between the proportion of Immigrants from Latvia and percentage of population with hearing disability in the United States with a correlation coefficient (R) of 0.673 and weighted average of 3.1%. Similarly, the statistical analysis conducted on geographies consisting of 148,077,684 people shows a mild positive correlation between the proportion of Immigrants from Switzerland and percentage of population with hearing disability in the United States with a correlation coefficient (R) of 0.351 and weighted average of 3.1%, a difference of 2.4%.
Hearing Disability Correlation Summary
| Measurement | Immigrants from Latvia | Immigrants from Switzerland |
| Minimum | 0.16% | 0.89% |
| Maximum | 17.1% | 20.2% |
| Range | 17.0% | 19.3% |
| Mean | 4.1% | 5.4% |
| Median | 3.6% | 3.5% |
| Interquartile 25% (IQ1) | 2.3% | 2.7% |
| Interquartile 75% (IQ3) | 5.0% | 4.7% |
| Interquartile Range (IQR) | 2.7% | 2.1% |
| Standard Deviation (Sample) | 3.1% | 5.0% |
| Standard Deviation (Population) | 3.0% | 4.9% |
Demographics Similar to Immigrants from Latvia and Immigrants from Switzerland by Hearing Disability
In terms of hearing disability, the demographic groups most similar to Immigrants from Latvia are Immigrants from Hungary (3.1%, a difference of 0.040%), Hispanic or Latino (3.1%, a difference of 0.46%), Eastern European (3.1%, a difference of 0.53%), Immigrants from Czechoslovakia (3.1%, a difference of 0.59%), and Alsatian (3.1%, a difference of 0.59%). Similarly, the demographic groups most similar to Immigrants from Switzerland are Korean (3.1%, a difference of 0.13%), Macedonian (3.1%, a difference of 0.21%), Immigrants from South Africa (3.1%, a difference of 0.25%), African (3.0%, a difference of 0.44%), and South African (3.1%, a difference of 0.51%).
| Demographics | Rating | Rank | Hearing Disability |
| Africans | 32.9 /100 | #189 | Fair 3.0% |
| Immigrants | South Africa | 31.1 /100 | #190 | Fair 3.1% |
| Immigrants | Switzerland | 28.8 /100 | #191 | Fair 3.1% |
| Koreans | 27.6 /100 | #192 | Fair 3.1% |
| Macedonians | 27.0 /100 | #193 | Fair 3.1% |
| South Africans | 24.5 /100 | #194 | Fair 3.1% |
| Spanish American Indians | 24.1 /100 | #195 | Fair 3.1% |
| Immigrants | Europe | 22.9 /100 | #196 | Fair 3.1% |
| Immigrants | Bosnia and Herzegovina | 20.6 /100 | #197 | Fair 3.1% |
| Immigrants | Croatia | 20.5 /100 | #198 | Fair 3.1% |
| Syrians | 19.2 /100 | #199 | Poor 3.1% |
| Immigrants | North Macedonia | 19.1 /100 | #200 | Poor 3.1% |
| Iraqis | 19.0 /100 | #201 | Poor 3.1% |
| Immigrants | Thailand | 16.4 /100 | #202 | Poor 3.1% |
| Immigrants | Denmark | 16.2 /100 | #203 | Poor 3.1% |
| Immigrants | Czechoslovakia | 15.9 /100 | #204 | Poor 3.1% |
| Alsatians | 15.9 /100 | #205 | Poor 3.1% |
| Eastern Europeans | 15.5 /100 | #206 | Poor 3.1% |
| Hispanics or Latinos | 15.1 /100 | #207 | Poor 3.1% |
| Immigrants | Latvia | 12.7 /100 | #208 | Poor 3.1% |
| Immigrants | Hungary | 12.5 /100 | #209 | Poor 3.1% |