Immigrants from Sierra Leone vs Tsimshian Hearing Disability
COMPARE
Immigrants from Sierra Leone
Tsimshian
Hearing Disability
Hearing Disability Comparison
Immigrants from Sierra Leone
Tsimshian
2.6%
HEARING DISABILITY
99.8/ 100
METRIC RATING
22nd/ 347
METRIC RANK
4.7%
HEARING DISABILITY
0.0/ 100
METRIC RATING
342nd/ 347
METRIC RANK
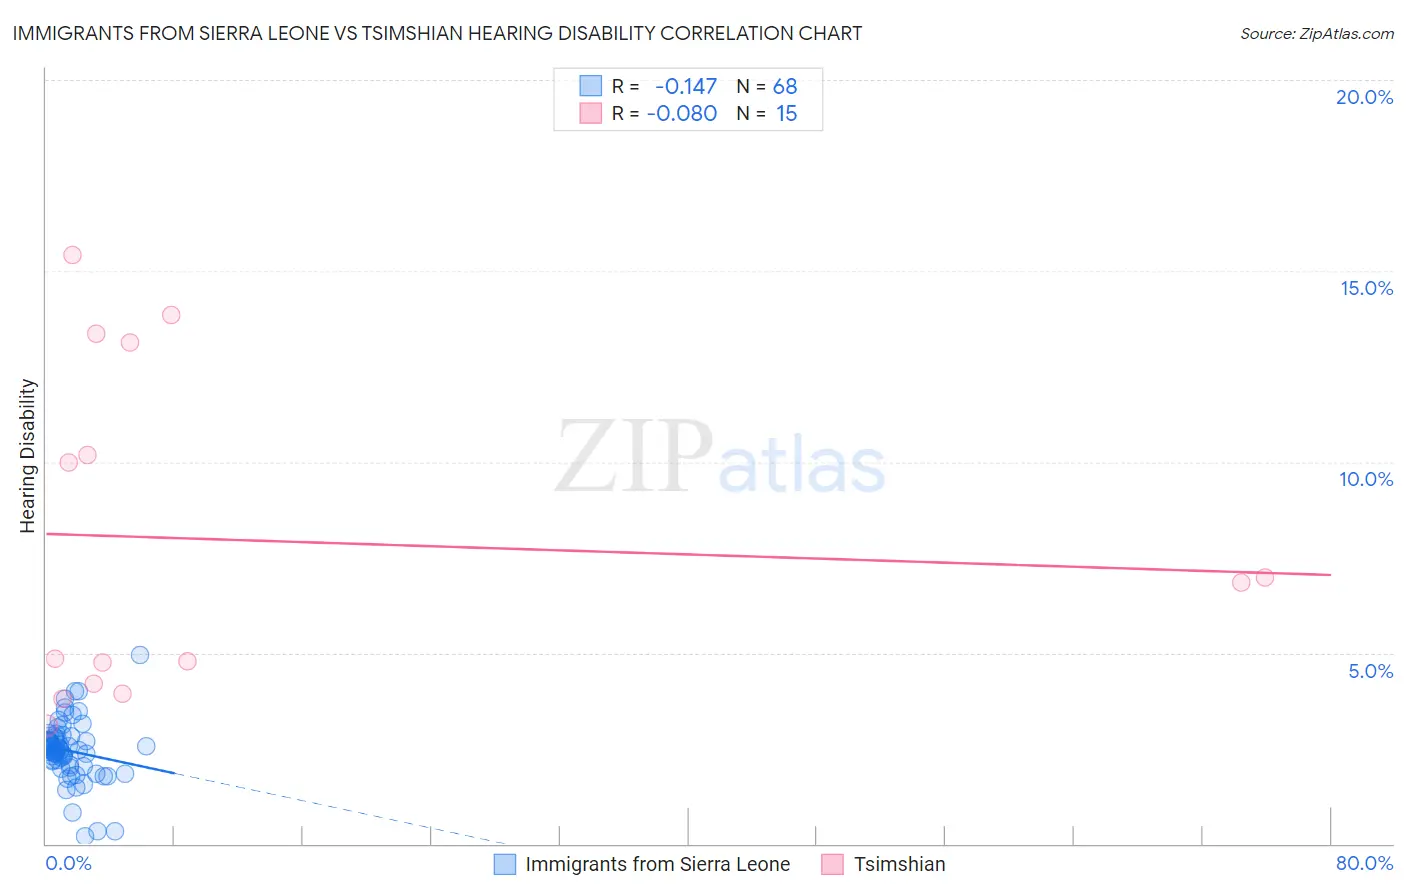
Immigrants from Sierra Leone vs Tsimshian Hearing Disability Correlation Chart
The statistical analysis conducted on geographies consisting of 101,639,141 people shows a poor negative correlation between the proportion of Immigrants from Sierra Leone and percentage of population with hearing disability in the United States with a correlation coefficient (R) of -0.147 and weighted average of 2.6%. Similarly, the statistical analysis conducted on geographies consisting of 15,626,462 people shows a slight negative correlation between the proportion of Tsimshian and percentage of population with hearing disability in the United States with a correlation coefficient (R) of -0.080 and weighted average of 4.7%, a difference of 84.4%.
Hearing Disability Correlation Summary
| Measurement | Immigrants from Sierra Leone | Tsimshian |
| Minimum | 0.20% | 3.1% |
| Maximum | 4.9% | 15.4% |
| Range | 4.7% | 12.3% |
| Mean | 2.4% | 7.9% |
| Median | 2.5% | 6.8% |
| Interquartile 25% (IQ1) | 2.0% | 4.2% |
| Interquartile 75% (IQ3) | 2.8% | 13.1% |
| Interquartile Range (IQR) | 0.72% | 8.9% |
| Standard Deviation (Sample) | 0.81% | 4.3% |
| Standard Deviation (Population) | 0.80% | 4.2% |
Similar Demographics by Hearing Disability
Demographics Similar to Immigrants from Sierra Leone by Hearing Disability
In terms of hearing disability, the demographic groups most similar to Immigrants from Sierra Leone are Ghanaian (2.5%, a difference of 0.040%), Immigrants from Bolivia (2.5%, a difference of 0.11%), Thai (2.5%, a difference of 0.16%), Dominican (2.5%, a difference of 0.18%), and Immigrants from Nigeria (2.6%, a difference of 0.50%).
| Demographics | Rating | Rank | Hearing Disability |
| Barbadians | 99.9 /100 | #15 | Exceptional 2.5% |
| Immigrants | West Indies | 99.9 /100 | #16 | Exceptional 2.5% |
| Immigrants | India | 99.9 /100 | #17 | Exceptional 2.5% |
| Dominicans | 99.8 /100 | #18 | Exceptional 2.5% |
| Thais | 99.8 /100 | #19 | Exceptional 2.5% |
| Immigrants | Bolivia | 99.8 /100 | #20 | Exceptional 2.5% |
| Ghanaians | 99.8 /100 | #21 | Exceptional 2.5% |
| Immigrants | Sierra Leone | 99.8 /100 | #22 | Exceptional 2.6% |
| Immigrants | Nigeria | 99.8 /100 | #23 | Exceptional 2.6% |
| Immigrants | Ghana | 99.8 /100 | #24 | Exceptional 2.6% |
| Immigrants | El Salvador | 99.7 /100 | #25 | Exceptional 2.6% |
| Immigrants | Senegal | 99.7 /100 | #26 | Exceptional 2.6% |
| Immigrants | South Central Asia | 99.7 /100 | #27 | Exceptional 2.6% |
| Immigrants | Haiti | 99.7 /100 | #28 | Exceptional 2.6% |
| Bolivians | 99.7 /100 | #29 | Exceptional 2.6% |
Demographics Similar to Tsimshian by Hearing Disability
In terms of hearing disability, the demographic groups most similar to Tsimshian are Inupiat (4.7%, a difference of 0.21%), Navajo (4.6%, a difference of 1.5%), Pueblo (4.6%, a difference of 1.9%), Tlingit-Haida (4.8%, a difference of 2.9%), and Choctaw (4.5%, a difference of 3.4%).
| Demographics | Rating | Rank | Hearing Disability |
| Dutch West Indians | 0.0 /100 | #333 | Tragic 4.3% |
| Aleuts | 0.0 /100 | #334 | Tragic 4.3% |
| Kiowa | 0.0 /100 | #335 | Tragic 4.3% |
| Creek | 0.0 /100 | #336 | Tragic 4.4% |
| Chickasaw | 0.0 /100 | #337 | Tragic 4.5% |
| Alaska Natives | 0.0 /100 | #338 | Tragic 4.5% |
| Choctaw | 0.0 /100 | #339 | Tragic 4.5% |
| Pueblo | 0.0 /100 | #340 | Tragic 4.6% |
| Navajo | 0.0 /100 | #341 | Tragic 4.6% |
| Tsimshian | 0.0 /100 | #342 | Tragic 4.7% |
| Inupiat | 0.0 /100 | #343 | Tragic 4.7% |
| Tlingit-Haida | 0.0 /100 | #344 | Tragic 4.8% |
| Alaskan Athabascans | 0.0 /100 | #345 | Tragic 5.3% |
| Colville | 0.0 /100 | #346 | Tragic 5.3% |
| Yup'ik | 0.0 /100 | #347 | Tragic 5.8% |