Immigrants from Latvia vs Immigrants from Mexico Ambulatory Disability
COMPARE
Immigrants from Latvia
Immigrants from Mexico
Ambulatory Disability
Ambulatory Disability Comparison
Immigrants from Latvia
Immigrants from Mexico
6.0%
AMBULATORY DISABILITY
71.1/ 100
METRIC RATING
159th/ 347
METRIC RANK
6.3%
AMBULATORY DISABILITY
11.0/ 100
METRIC RATING
214th/ 347
METRIC RANK
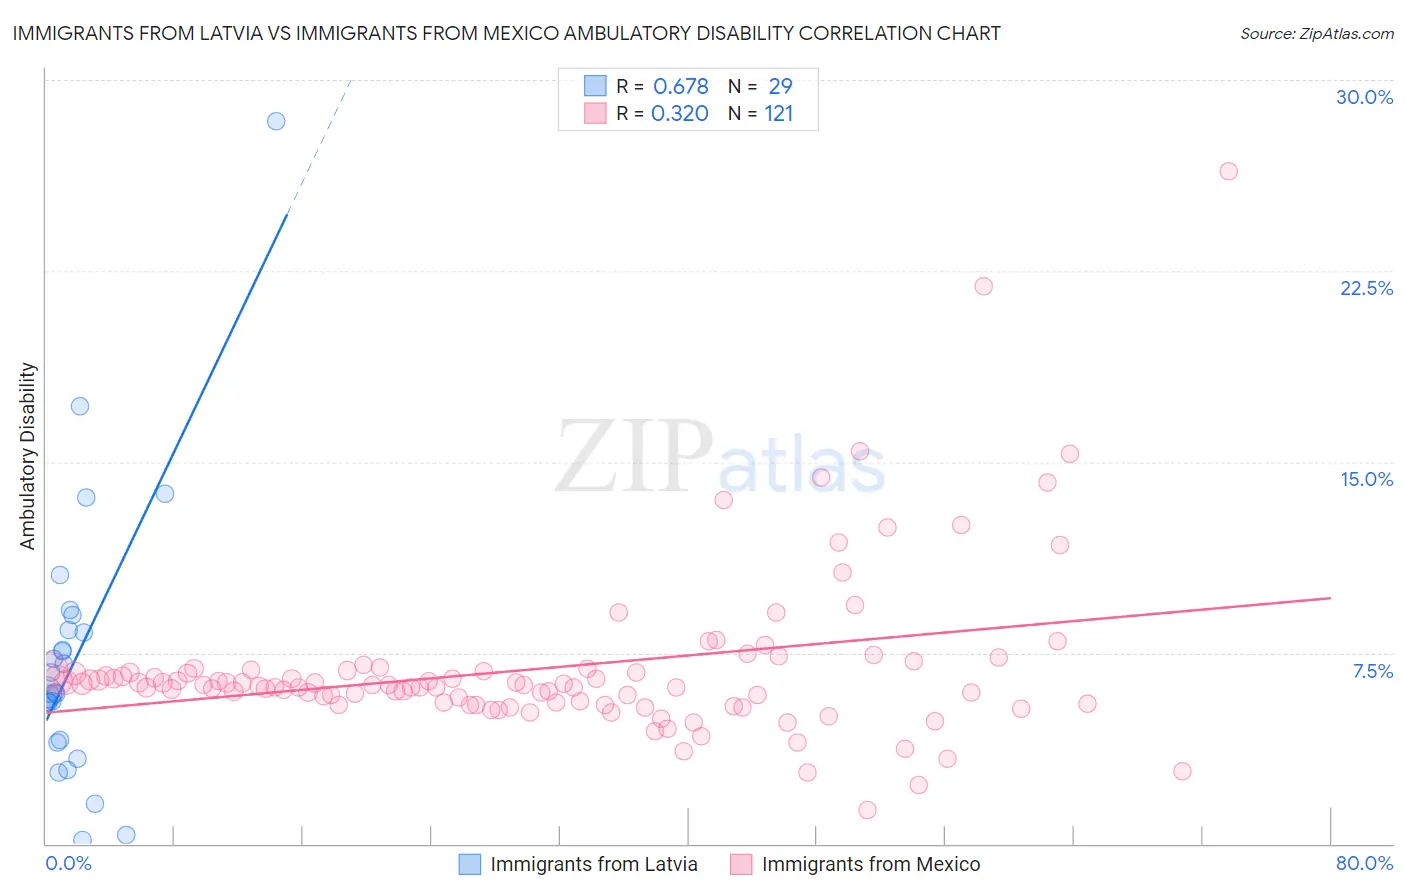
Immigrants from Latvia vs Immigrants from Mexico Ambulatory Disability Correlation Chart
The statistical analysis conducted on geographies consisting of 113,736,193 people shows a significant positive correlation between the proportion of Immigrants from Latvia and percentage of population with ambulatory disability in the United States with a correlation coefficient (R) of 0.678 and weighted average of 6.0%. Similarly, the statistical analysis conducted on geographies consisting of 513,370,670 people shows a mild positive correlation between the proportion of Immigrants from Mexico and percentage of population with ambulatory disability in the United States with a correlation coefficient (R) of 0.320 and weighted average of 6.3%, a difference of 4.0%.
Ambulatory Disability Correlation Summary
| Measurement | Immigrants from Latvia | Immigrants from Mexico |
| Minimum | 0.16% | 1.3% |
| Maximum | 28.4% | 26.4% |
| Range | 28.2% | 25.1% |
| Mean | 7.4% | 6.9% |
| Median | 6.0% | 6.2% |
| Interquartile 25% (IQ1) | 4.0% | 5.5% |
| Interquartile 75% (IQ3) | 8.7% | 6.8% |
| Interquartile Range (IQR) | 4.7% | 1.3% |
| Standard Deviation (Sample) | 5.6% | 3.3% |
| Standard Deviation (Population) | 5.5% | 3.3% |
Similar Demographics by Ambulatory Disability
Demographics Similar to Immigrants from Latvia by Ambulatory Disability
In terms of ambulatory disability, the demographic groups most similar to Immigrants from Latvia are Immigrants from Fiji (6.0%, a difference of 0.010%), Ghanaian (6.0%, a difference of 0.020%), Northern European (6.0%, a difference of 0.050%), Immigrants from Scotland (6.0%, a difference of 0.070%), and Central American (6.0%, a difference of 0.080%).
| Demographics | Rating | Rank | Ambulatory Disability |
| Immigrants | Austria | 78.8 /100 | #152 | Good 6.0% |
| Syrians | 75.5 /100 | #153 | Good 6.0% |
| Immigrants | Croatia | 75.1 /100 | #154 | Good 6.0% |
| Immigrants | Scotland | 72.1 /100 | #155 | Good 6.0% |
| Northern Europeans | 71.8 /100 | #156 | Good 6.0% |
| Ghanaians | 71.3 /100 | #157 | Good 6.0% |
| Immigrants | Fiji | 71.2 /100 | #158 | Good 6.0% |
| Immigrants | Latvia | 71.1 /100 | #159 | Good 6.0% |
| Central Americans | 69.8 /100 | #160 | Good 6.0% |
| Immigrants | Belarus | 69.2 /100 | #161 | Good 6.1% |
| Nigerians | 67.1 /100 | #162 | Good 6.1% |
| Lebanese | 66.2 /100 | #163 | Good 6.1% |
| Basques | 63.7 /100 | #164 | Good 6.1% |
| Nicaraguans | 63.2 /100 | #165 | Good 6.1% |
| Iraqis | 62.8 /100 | #166 | Good 6.1% |
Demographics Similar to Immigrants from Mexico by Ambulatory Disability
In terms of ambulatory disability, the demographic groups most similar to Immigrants from Mexico are Immigrants from Latin America (6.3%, a difference of 0.010%), Canadian (6.3%, a difference of 0.020%), Yugoslavian (6.3%, a difference of 0.020%), Guamanian/Chamorro (6.3%, a difference of 0.060%), and Mexican American Indian (6.3%, a difference of 0.12%).
| Demographics | Rating | Rank | Ambulatory Disability |
| Alsatians | 15.1 /100 | #207 | Poor 6.3% |
| Bangladeshis | 14.2 /100 | #208 | Poor 6.3% |
| Immigrants | Iraq | 14.0 /100 | #209 | Poor 6.3% |
| Immigrants | Laos | 13.2 /100 | #210 | Poor 6.3% |
| Samoans | 12.1 /100 | #211 | Poor 6.3% |
| Mexican American Indians | 12.0 /100 | #212 | Poor 6.3% |
| Japanese | 12.0 /100 | #213 | Poor 6.3% |
| Immigrants | Mexico | 11.0 /100 | #214 | Poor 6.3% |
| Immigrants | Latin America | 11.0 /100 | #215 | Poor 6.3% |
| Canadians | 10.9 /100 | #216 | Poor 6.3% |
| Yugoslavians | 10.9 /100 | #217 | Poor 6.3% |
| Guamanians/Chamorros | 10.6 /100 | #218 | Poor 6.3% |
| Indonesians | 9.9 /100 | #219 | Tragic 6.3% |
| Immigrants | Albania | 9.6 /100 | #220 | Tragic 6.3% |
| Hungarians | 9.6 /100 | #221 | Tragic 6.3% |