Immigrants from Latvia vs Arab Ambulatory Disability
COMPARE
Immigrants from Latvia
Arab
Ambulatory Disability
Ambulatory Disability Comparison
Immigrants from Latvia
Arabs
6.0%
AMBULATORY DISABILITY
71.1/ 100
METRIC RATING
159th/ 347
METRIC RANK
5.9%
AMBULATORY DISABILITY
91.5/ 100
METRIC RATING
126th/ 347
METRIC RANK
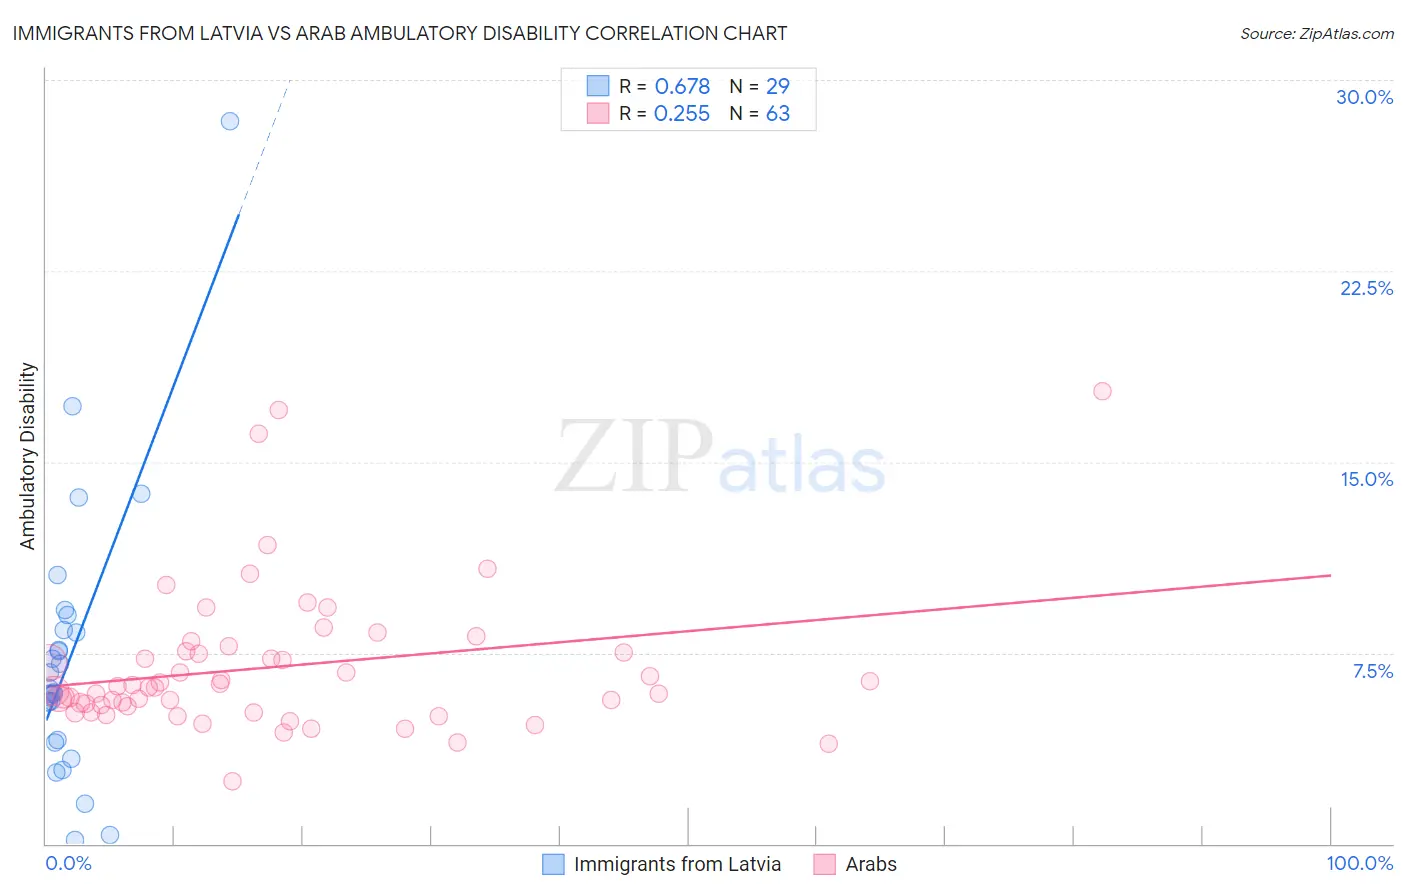
Immigrants from Latvia vs Arab Ambulatory Disability Correlation Chart
The statistical analysis conducted on geographies consisting of 113,736,193 people shows a significant positive correlation between the proportion of Immigrants from Latvia and percentage of population with ambulatory disability in the United States with a correlation coefficient (R) of 0.678 and weighted average of 6.0%. Similarly, the statistical analysis conducted on geographies consisting of 486,612,258 people shows a weak positive correlation between the proportion of Arabs and percentage of population with ambulatory disability in the United States with a correlation coefficient (R) of 0.255 and weighted average of 5.9%, a difference of 2.0%.
Ambulatory Disability Correlation Summary
| Measurement | Immigrants from Latvia | Arab |
| Minimum | 0.16% | 2.5% |
| Maximum | 28.4% | 17.8% |
| Range | 28.2% | 15.3% |
| Mean | 7.4% | 7.0% |
| Median | 6.0% | 6.2% |
| Interquartile 25% (IQ1) | 4.0% | 5.4% |
| Interquartile 75% (IQ3) | 8.7% | 7.5% |
| Interquartile Range (IQR) | 4.7% | 2.1% |
| Standard Deviation (Sample) | 5.6% | 2.9% |
| Standard Deviation (Population) | 5.5% | 2.8% |
Similar Demographics by Ambulatory Disability
Demographics Similar to Immigrants from Latvia by Ambulatory Disability
In terms of ambulatory disability, the demographic groups most similar to Immigrants from Latvia are Immigrants from Fiji (6.0%, a difference of 0.010%), Ghanaian (6.0%, a difference of 0.020%), Northern European (6.0%, a difference of 0.050%), Immigrants from Scotland (6.0%, a difference of 0.070%), and Central American (6.0%, a difference of 0.080%).
| Demographics | Rating | Rank | Ambulatory Disability |
| Immigrants | Austria | 78.8 /100 | #152 | Good 6.0% |
| Syrians | 75.5 /100 | #153 | Good 6.0% |
| Immigrants | Croatia | 75.1 /100 | #154 | Good 6.0% |
| Immigrants | Scotland | 72.1 /100 | #155 | Good 6.0% |
| Northern Europeans | 71.8 /100 | #156 | Good 6.0% |
| Ghanaians | 71.3 /100 | #157 | Good 6.0% |
| Immigrants | Fiji | 71.2 /100 | #158 | Good 6.0% |
| Immigrants | Latvia | 71.1 /100 | #159 | Good 6.0% |
| Central Americans | 69.8 /100 | #160 | Good 6.0% |
| Immigrants | Belarus | 69.2 /100 | #161 | Good 6.1% |
| Nigerians | 67.1 /100 | #162 | Good 6.1% |
| Lebanese | 66.2 /100 | #163 | Good 6.1% |
| Basques | 63.7 /100 | #164 | Good 6.1% |
| Nicaraguans | 63.2 /100 | #165 | Good 6.1% |
| Iraqis | 62.8 /100 | #166 | Good 6.1% |
Demographics Similar to Arabs by Ambulatory Disability
In terms of ambulatory disability, the demographic groups most similar to Arabs are Korean (5.9%, a difference of 0.020%), Immigrants from Nigeria (5.9%, a difference of 0.10%), Immigrants from Western Asia (5.9%, a difference of 0.13%), Immigrants from Middle Africa (5.9%, a difference of 0.14%), and Immigrants from Norway (5.9%, a difference of 0.17%).
| Demographics | Rating | Rank | Ambulatory Disability |
| Norwegians | 93.1 /100 | #119 | Exceptional 5.9% |
| Estonians | 92.9 /100 | #120 | Exceptional 5.9% |
| Costa Ricans | 92.6 /100 | #121 | Exceptional 5.9% |
| Icelanders | 92.6 /100 | #122 | Exceptional 5.9% |
| Immigrants | Russia | 92.4 /100 | #123 | Exceptional 5.9% |
| Immigrants | Middle Africa | 92.2 /100 | #124 | Exceptional 5.9% |
| Koreans | 91.6 /100 | #125 | Exceptional 5.9% |
| Arabs | 91.5 /100 | #126 | Exceptional 5.9% |
| Immigrants | Nigeria | 90.9 /100 | #127 | Exceptional 5.9% |
| Immigrants | Western Asia | 90.7 /100 | #128 | Exceptional 5.9% |
| Immigrants | Norway | 90.5 /100 | #129 | Exceptional 5.9% |
| Immigrants | Kazakhstan | 89.7 /100 | #130 | Excellent 5.9% |
| Immigrants | Costa Rica | 89.5 /100 | #131 | Excellent 5.9% |
| Immigrants | Europe | 87.8 /100 | #132 | Excellent 6.0% |
| Immigrants | Immigrants | 86.9 /100 | #133 | Excellent 6.0% |