Belizean vs Immigrants from Mexico Ambulatory Disability
COMPARE
Belizean
Immigrants from Mexico
Ambulatory Disability
Ambulatory Disability Comparison
Belizeans
Immigrants from Mexico
6.5%
AMBULATORY DISABILITY
0.7/ 100
METRIC RATING
254th/ 347
METRIC RANK
6.3%
AMBULATORY DISABILITY
11.0/ 100
METRIC RATING
214th/ 347
METRIC RANK
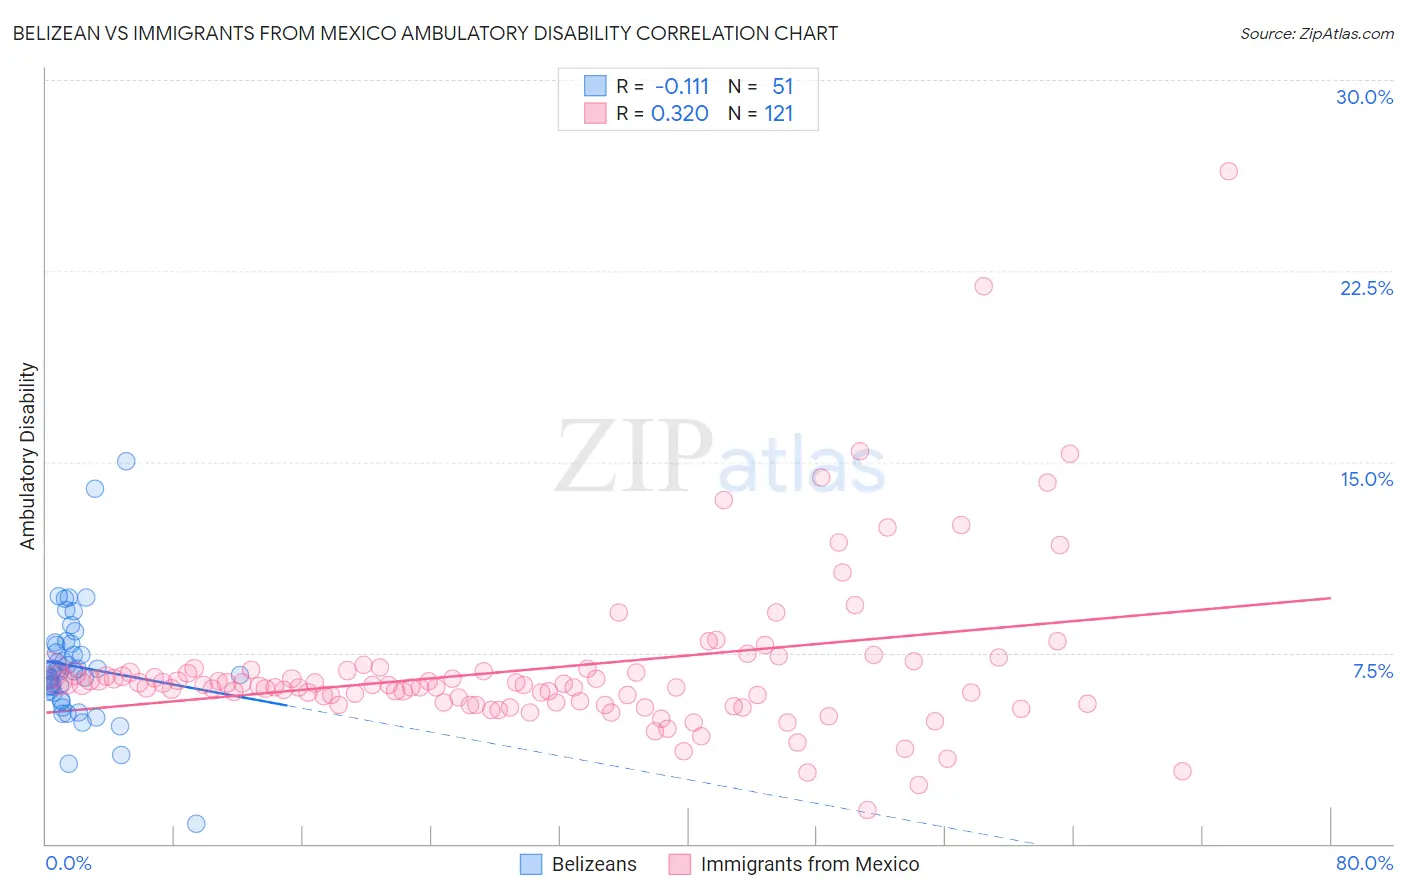
Belizean vs Immigrants from Mexico Ambulatory Disability Correlation Chart
The statistical analysis conducted on geographies consisting of 144,187,232 people shows a poor negative correlation between the proportion of Belizeans and percentage of population with ambulatory disability in the United States with a correlation coefficient (R) of -0.111 and weighted average of 6.5%. Similarly, the statistical analysis conducted on geographies consisting of 513,370,670 people shows a mild positive correlation between the proportion of Immigrants from Mexico and percentage of population with ambulatory disability in the United States with a correlation coefficient (R) of 0.320 and weighted average of 6.3%, a difference of 3.8%.
Ambulatory Disability Correlation Summary
| Measurement | Belizean | Immigrants from Mexico |
| Minimum | 0.81% | 1.3% |
| Maximum | 15.0% | 26.4% |
| Range | 14.2% | 25.1% |
| Mean | 7.0% | 6.9% |
| Median | 6.8% | 6.2% |
| Interquartile 25% (IQ1) | 5.9% | 5.5% |
| Interquartile 75% (IQ3) | 7.9% | 6.8% |
| Interquartile Range (IQR) | 1.9% | 1.3% |
| Standard Deviation (Sample) | 2.3% | 3.3% |
| Standard Deviation (Population) | 2.3% | 3.3% |
Similar Demographics by Ambulatory Disability
Demographics Similar to Belizeans by Ambulatory Disability
In terms of ambulatory disability, the demographic groups most similar to Belizeans are Welsh (6.5%, a difference of 0.070%), Immigrants from Uzbekistan (6.5%, a difference of 0.15%), Scottish (6.5%, a difference of 0.16%), Immigrants from Bahamas (6.5%, a difference of 0.21%), and Bermudan (6.5%, a difference of 0.23%).
| Demographics | Rating | Rank | Ambulatory Disability |
| Immigrants | Cuba | 1.4 /100 | #247 | Tragic 6.5% |
| Immigrants | Portugal | 1.4 /100 | #248 | Tragic 6.5% |
| Native Hawaiians | 1.1 /100 | #249 | Tragic 6.5% |
| Chinese | 1.0 /100 | #250 | Tragic 6.5% |
| Hawaiians | 0.9 /100 | #251 | Tragic 6.5% |
| Immigrants | Bahamas | 0.8 /100 | #252 | Tragic 6.5% |
| Scottish | 0.7 /100 | #253 | Tragic 6.5% |
| Belizeans | 0.7 /100 | #254 | Tragic 6.5% |
| Welsh | 0.6 /100 | #255 | Tragic 6.5% |
| Immigrants | Uzbekistan | 0.6 /100 | #256 | Tragic 6.5% |
| Bermudans | 0.5 /100 | #257 | Tragic 6.5% |
| Spanish American Indians | 0.5 /100 | #258 | Tragic 6.5% |
| Aleuts | 0.4 /100 | #259 | Tragic 6.6% |
| Immigrants | Belize | 0.4 /100 | #260 | Tragic 6.6% |
| Irish | 0.4 /100 | #261 | Tragic 6.6% |
Demographics Similar to Immigrants from Mexico by Ambulatory Disability
In terms of ambulatory disability, the demographic groups most similar to Immigrants from Mexico are Immigrants from Latin America (6.3%, a difference of 0.010%), Canadian (6.3%, a difference of 0.020%), Yugoslavian (6.3%, a difference of 0.020%), Guamanian/Chamorro (6.3%, a difference of 0.060%), and Mexican American Indian (6.3%, a difference of 0.12%).
| Demographics | Rating | Rank | Ambulatory Disability |
| Alsatians | 15.1 /100 | #207 | Poor 6.3% |
| Bangladeshis | 14.2 /100 | #208 | Poor 6.3% |
| Immigrants | Iraq | 14.0 /100 | #209 | Poor 6.3% |
| Immigrants | Laos | 13.2 /100 | #210 | Poor 6.3% |
| Samoans | 12.1 /100 | #211 | Poor 6.3% |
| Mexican American Indians | 12.0 /100 | #212 | Poor 6.3% |
| Japanese | 12.0 /100 | #213 | Poor 6.3% |
| Immigrants | Mexico | 11.0 /100 | #214 | Poor 6.3% |
| Immigrants | Latin America | 11.0 /100 | #215 | Poor 6.3% |
| Canadians | 10.9 /100 | #216 | Poor 6.3% |
| Yugoslavians | 10.9 /100 | #217 | Poor 6.3% |
| Guamanians/Chamorros | 10.6 /100 | #218 | Poor 6.3% |
| Indonesians | 9.9 /100 | #219 | Tragic 6.3% |
| Immigrants | Albania | 9.6 /100 | #220 | Tragic 6.3% |
| Hungarians | 9.6 /100 | #221 | Tragic 6.3% |