Immigrants from Laos vs Immigrants from Jordan Disability
COMPARE
Immigrants from Laos
Immigrants from Jordan
Disability
Disability Comparison
Immigrants from Laos
Immigrants from Jordan
12.4%
DISABILITY
0.5/ 100
METRIC RATING
257th/ 347
METRIC RANK
11.1%
DISABILITY
99.3/ 100
METRIC RATING
79th/ 347
METRIC RANK
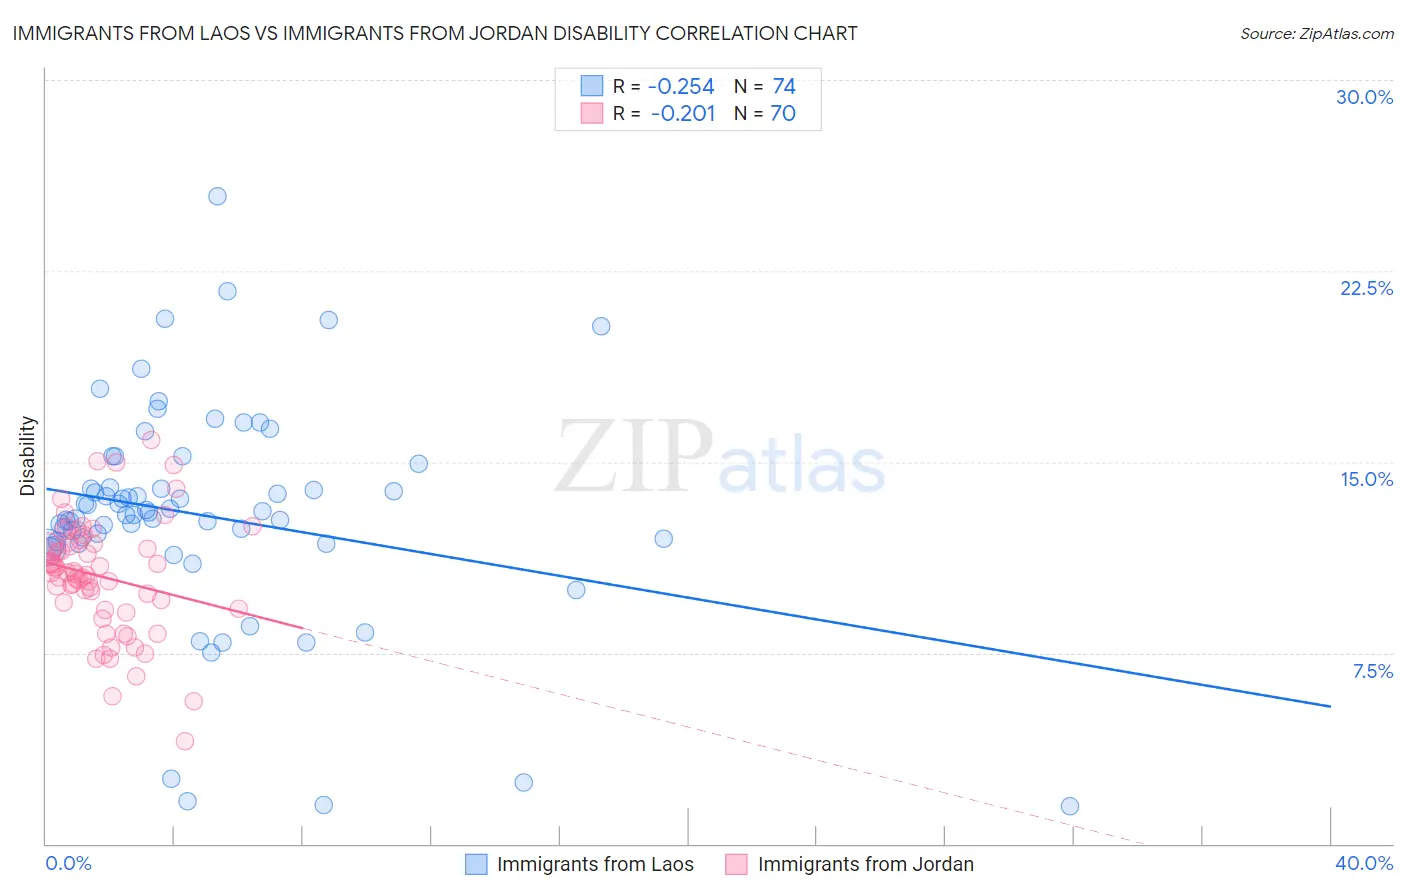
Immigrants from Laos vs Immigrants from Jordan Disability Correlation Chart
The statistical analysis conducted on geographies consisting of 201,466,628 people shows a weak negative correlation between the proportion of Immigrants from Laos and percentage of population with a disability in the United States with a correlation coefficient (R) of -0.254 and weighted average of 12.4%. Similarly, the statistical analysis conducted on geographies consisting of 181,277,491 people shows a weak negative correlation between the proportion of Immigrants from Jordan and percentage of population with a disability in the United States with a correlation coefficient (R) of -0.201 and weighted average of 11.1%, a difference of 11.9%.
Disability Correlation Summary
| Measurement | Immigrants from Laos | Immigrants from Jordan |
| Minimum | 1.4% | 4.0% |
| Maximum | 25.4% | 15.9% |
| Range | 24.0% | 11.8% |
| Mean | 12.9% | 10.5% |
| Median | 13.0% | 10.6% |
| Interquartile 25% (IQ1) | 11.8% | 9.2% |
| Interquartile 75% (IQ3) | 14.0% | 11.8% |
| Interquartile Range (IQR) | 2.2% | 2.5% |
| Standard Deviation (Sample) | 4.3% | 2.3% |
| Standard Deviation (Population) | 4.3% | 2.2% |
Similar Demographics by Disability
Demographics Similar to Immigrants from Laos by Disability
In terms of disability, the demographic groups most similar to Immigrants from Laos are Immigrants from Dominica (12.4%, a difference of 0.090%), Slavic (12.4%, a difference of 0.14%), Slovene (12.4%, a difference of 0.16%), Canadian (12.4%, a difference of 0.20%), and Immigrants from Liberia (12.4%, a difference of 0.23%).
| Demographics | Rating | Rank | Disability |
| Sub-Saharan Africans | 1.4 /100 | #250 | Tragic 12.3% |
| Europeans | 1.4 /100 | #251 | Tragic 12.3% |
| Bermudans | 1.1 /100 | #252 | Tragic 12.3% |
| Belgians | 0.8 /100 | #253 | Tragic 12.3% |
| German Russians | 0.8 /100 | #254 | Tragic 12.3% |
| Slovenes | 0.6 /100 | #255 | Tragic 12.4% |
| Immigrants | Dominica | 0.6 /100 | #256 | Tragic 12.4% |
| Immigrants | Laos | 0.5 /100 | #257 | Tragic 12.4% |
| Slavs | 0.5 /100 | #258 | Tragic 12.4% |
| Canadians | 0.4 /100 | #259 | Tragic 12.4% |
| Immigrants | Liberia | 0.4 /100 | #260 | Tragic 12.4% |
| Scandinavians | 0.4 /100 | #261 | Tragic 12.4% |
| Native Hawaiians | 0.3 /100 | #262 | Tragic 12.5% |
| Hawaiians | 0.2 /100 | #263 | Tragic 12.5% |
| Immigrants | Germany | 0.2 /100 | #264 | Tragic 12.5% |
Demographics Similar to Immigrants from Jordan by Disability
In terms of disability, the demographic groups most similar to Immigrants from Jordan are Immigrants from Cameroon (11.1%, a difference of 0.040%), Immigrants from Ireland (11.1%, a difference of 0.050%), Immigrants from Belgium (11.0%, a difference of 0.070%), Sierra Leonean (11.0%, a difference of 0.080%), and Immigrants from Vietnam (11.0%, a difference of 0.10%).
| Demographics | Rating | Rank | Disability |
| Immigrants | Chile | 99.4 /100 | #72 | Exceptional 11.0% |
| Immigrants | Bangladesh | 99.4 /100 | #73 | Exceptional 11.0% |
| Immigrants | Serbia | 99.4 /100 | #74 | Exceptional 11.0% |
| Immigrants | Vietnam | 99.4 /100 | #75 | Exceptional 11.0% |
| Sierra Leoneans | 99.3 /100 | #76 | Exceptional 11.0% |
| Immigrants | Belgium | 99.3 /100 | #77 | Exceptional 11.0% |
| Immigrants | Cameroon | 99.3 /100 | #78 | Exceptional 11.1% |
| Immigrants | Jordan | 99.3 /100 | #79 | Exceptional 11.1% |
| Immigrants | Ireland | 99.3 /100 | #80 | Exceptional 11.1% |
| Immigrants | Poland | 99.1 /100 | #81 | Exceptional 11.1% |
| Chileans | 99.1 /100 | #82 | Exceptional 11.1% |
| Immigrants | Switzerland | 99.0 /100 | #83 | Exceptional 11.1% |
| Immigrants | Sierra Leone | 99.0 /100 | #84 | Exceptional 11.1% |
| Immigrants | Belarus | 98.9 /100 | #85 | Exceptional 11.1% |
| Immigrants | Russia | 98.9 /100 | #86 | Exceptional 11.1% |