Immigrants from Laos vs Malaysian 3rd Grade
COMPARE
Immigrants from Laos
Malaysian
3rd Grade
3rd Grade Comparison
Immigrants from Laos
Malaysians
96.6%
3RD GRADE
0.0/ 100
METRIC RATING
312th/ 347
METRIC RANK
97.0%
3RD GRADE
0.0/ 100
METRIC RATING
294th/ 347
METRIC RANK
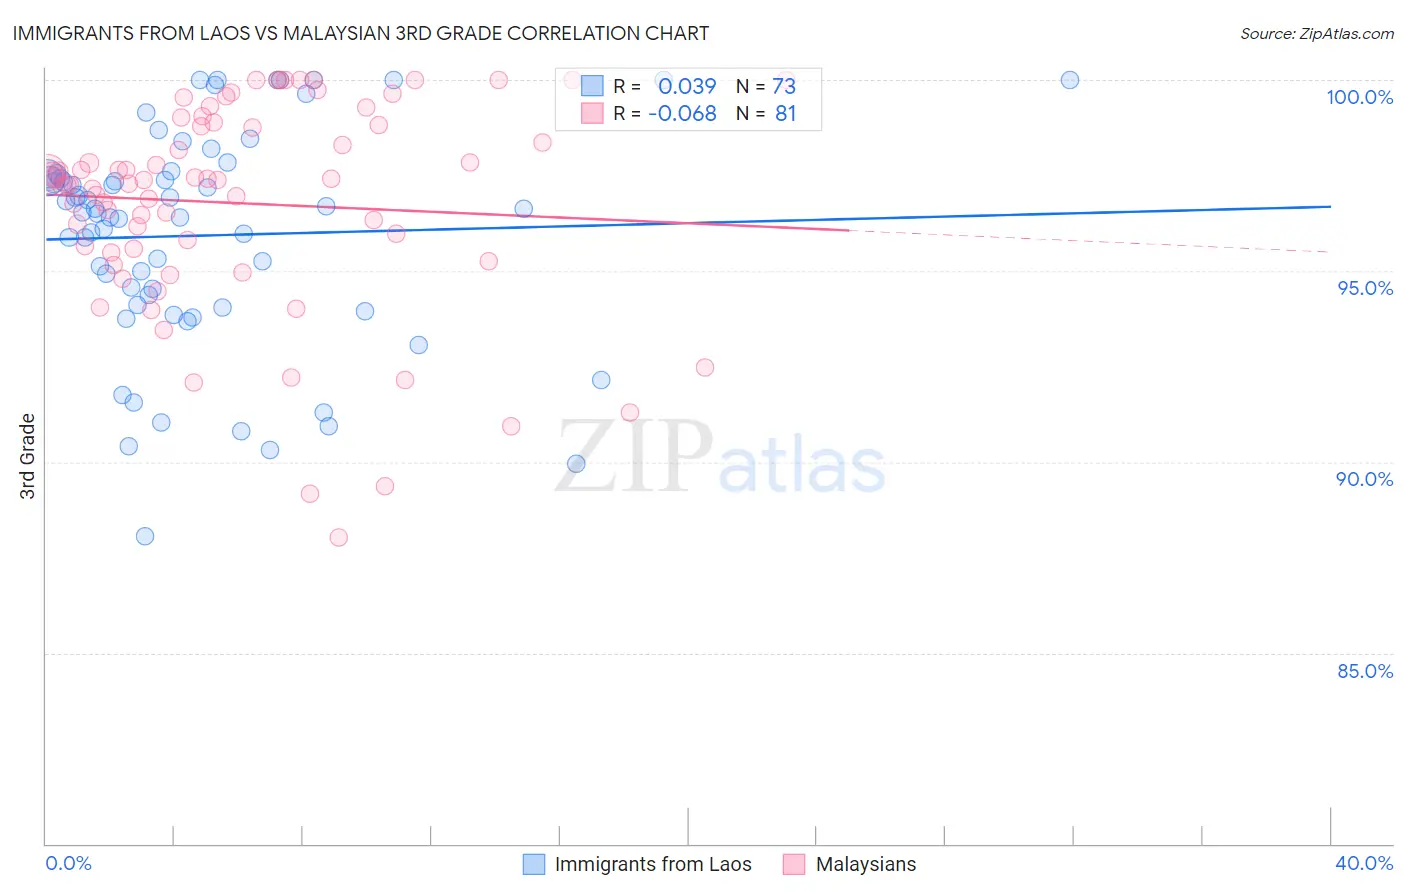
Immigrants from Laos vs Malaysian 3rd Grade Correlation Chart
The statistical analysis conducted on geographies consisting of 201,453,273 people shows no correlation between the proportion of Immigrants from Laos and percentage of population with at least 3rd grade education in the United States with a correlation coefficient (R) of 0.039 and weighted average of 96.6%. Similarly, the statistical analysis conducted on geographies consisting of 226,107,000 people shows a slight negative correlation between the proportion of Malaysians and percentage of population with at least 3rd grade education in the United States with a correlation coefficient (R) of -0.068 and weighted average of 97.0%, a difference of 0.40%.
3rd Grade Correlation Summary
| Measurement | Immigrants from Laos | Malaysian |
| Minimum | 88.0% | 88.0% |
| Maximum | 100.0% | 100.0% |
| Range | 12.0% | 12.0% |
| Mean | 95.9% | 96.8% |
| Median | 96.5% | 97.4% |
| Interquartile 25% (IQ1) | 94.1% | 95.5% |
| Interquartile 75% (IQ3) | 97.5% | 98.9% |
| Interquartile Range (IQR) | 3.4% | 3.3% |
| Standard Deviation (Sample) | 2.9% | 2.7% |
| Standard Deviation (Population) | 2.8% | 2.7% |
Demographics Similar to Immigrants from Laos and Malaysians by 3rd Grade
In terms of 3rd grade, the demographic groups most similar to Immigrants from Laos are Immigrants from Ecuador (96.6%, a difference of 0.010%), Immigrants from Guyana (96.6%, a difference of 0.020%), Cape Verdean (96.6%, a difference of 0.040%), Nicaraguan (96.7%, a difference of 0.070%), and Immigrants from Haiti (96.7%, a difference of 0.070%). Similarly, the demographic groups most similar to Malaysians are Immigrants from Grenada (97.0%, a difference of 0.010%), Immigrants from Eritrea (97.0%, a difference of 0.010%), Immigrants (96.9%, a difference of 0.11%), Haitian (96.9%, a difference of 0.14%), and Immigrants from Dominica (96.9%, a difference of 0.14%).
| Demographics | Rating | Rank | 3rd Grade |
| Immigrants | Grenada | 0.0 /100 | #293 | Tragic 97.0% |
| Malaysians | 0.0 /100 | #294 | Tragic 97.0% |
| Immigrants | Eritrea | 0.0 /100 | #295 | Tragic 97.0% |
| Immigrants | Immigrants | 0.0 /100 | #296 | Tragic 96.9% |
| Haitians | 0.0 /100 | #297 | Tragic 96.9% |
| Immigrants | Dominica | 0.0 /100 | #298 | Tragic 96.9% |
| Somalis | 0.0 /100 | #299 | Tragic 96.8% |
| Immigrants | South Eastern Asia | 0.0 /100 | #300 | Tragic 96.8% |
| Immigrants | Cuba | 0.0 /100 | #301 | Tragic 96.8% |
| Immigrants | Somalia | 0.0 /100 | #302 | Tragic 96.8% |
| Ecuadorians | 0.0 /100 | #303 | Tragic 96.7% |
| Immigrants | Caribbean | 0.0 /100 | #304 | Tragic 96.7% |
| Central American Indians | 0.0 /100 | #305 | Tragic 96.7% |
| Guyanese | 0.0 /100 | #306 | Tragic 96.7% |
| Nicaraguans | 0.0 /100 | #307 | Tragic 96.7% |
| Immigrants | Haiti | 0.0 /100 | #308 | Tragic 96.7% |
| Sri Lankans | 0.0 /100 | #309 | Tragic 96.7% |
| Cape Verdeans | 0.0 /100 | #310 | Tragic 96.6% |
| Immigrants | Guyana | 0.0 /100 | #311 | Tragic 96.6% |
| Immigrants | Laos | 0.0 /100 | #312 | Tragic 96.6% |
| Immigrants | Ecuador | 0.0 /100 | #313 | Tragic 96.6% |